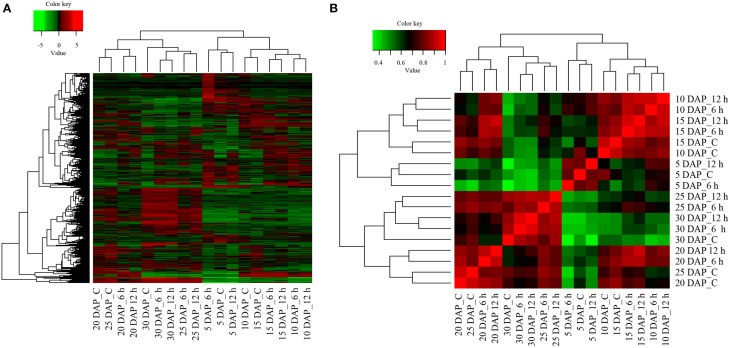
Figure 3.
Analysis of differentially expressed transcripts and their inter-relationships in B. juncea siliques. (A) Heat map of differentially expressed transcripts in control and cold stressed B. juncea siliques at different stages of development. Differentially expressed transcripts identified by pair-wise comparisons of all the 18 samples were clustered together on the basis of their expression values and heat map was plotted with TMM-normalized FPKM values. (B) Spearman correlation matrix of all the samples indicating extent of similarity between each possible pair. All the 13,342 transcripts exhibiting differential expression were clustered together and Spearman correlation matrix was plotted on TMM-normalized FPKM values. The key for sample labels should be interpreted as x DAP_y, where x denotes number of days; DAP represents days after pollination and y denotes either unstressed siliques –“C” or duration of cold stress in hours –“h”.

