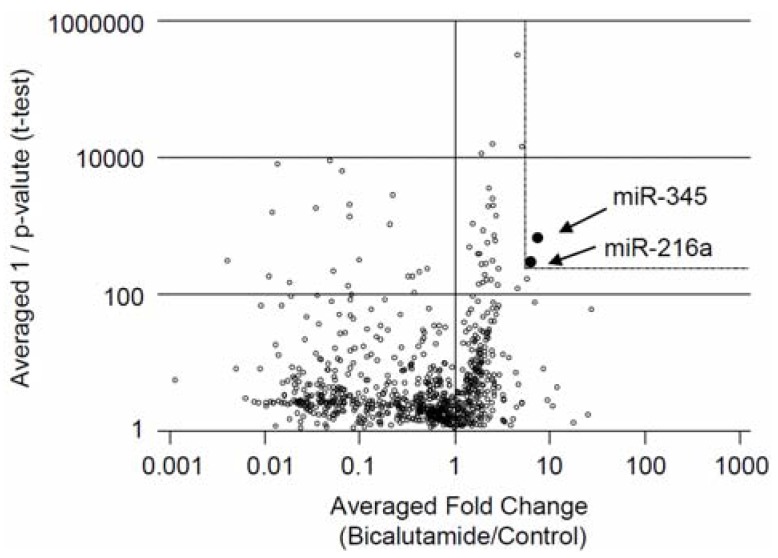
Figure 2.
Volcano plot shows comparative analysis of miRNA microarray of the averaged three groups of the bicalutamide-treated cells and vehicle-treated cells. Volcano plot of microarray data generated by clustering based on probes that were retained (fold change >5; p < 0.01) in the averaged three groups of the bicalutamide-treated cells compared to vehicle-treated cells (Control). Closed circles represent selected miRNAs in this study.

