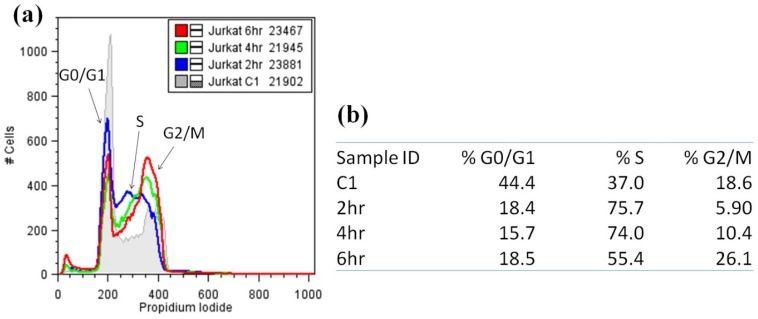
Figure 4.
Cell cycle analysis of Jurkat cells treated with nuiapolide (1), 5 μg/mL. (a) Histograms of Jurkat cells stained with propidium iodide (numbers in the legend indicate the number of cells plotted for each treatment); (b) Table providing the % of cells distributed in each stage of the cell cycle.

