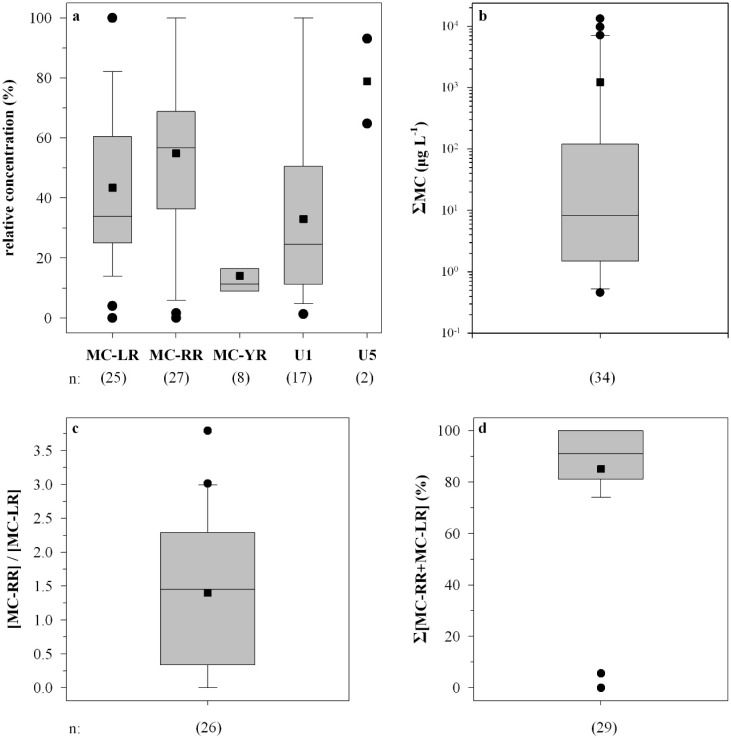
Figure 2.
Box and whisker plots of the relative concentration of each microcystin quantified (a); the total microcystin concentration (ΣMC) in cyanobacterial bloom samples (b); the MC-RR to MC-LR intracellular concentration ratio (c); and the sum of MC-LR and MC-RR intracellular concentrations (%) to the ΣMC (d). n represents number of samples; U1, U5 denote the unidentified microcystin.

