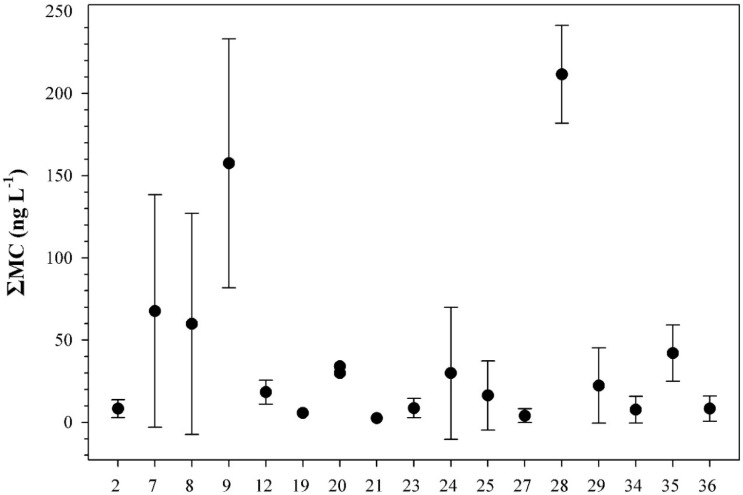
Figure 7.
Distribution of the ΣMC values in freshwater bodies without blooms used for recreation or other purposes. Numbers on the x-axis indicate the freshwater number given in Figure 1. Each point represents the mean value and the standard deviation of the methods (PP1IA, ELISA) used.

