Figure 2.
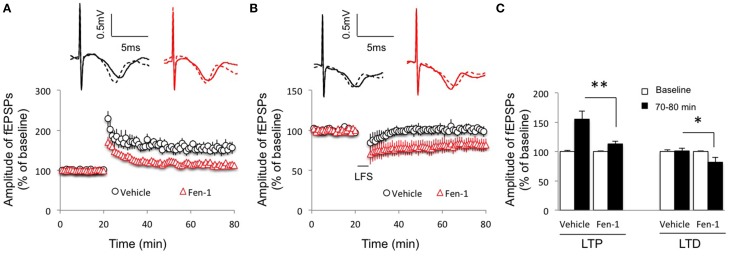
Effect of fentanyl exposure and washout on LTP in the hippocampal CA1 area. (A) Hippocampal LTP was recorded after 30 min fentanyl (1 μM) exposure and 60 min washout in the indicated groups. LTP was reduced in fentanyl-treated slices. (B) Hippocampal LTD was recorded after 30 min fentanyl (1 μM) exposure and 60 min washout in the indicated groups. LTD was facilitated in fentanyl-treated slices. (C) LTP and LTD readings among indicated groups were calculated by an average of fEPSP amplitudes during baseline (0–20 min) and the last 10 min of recordings (70–80 min). *p < 0.05, **p < 0.01 Vehicle-treated group vs. fentanyl-treated group. Data presented as mean ± SEM. N = 9–14 per group from six rats. Inserts show representative traces of fEPSP in slices treated with vehicle (black) or 1 μM fentanyl (red) before tetanus stimulation (solid line) and at the end of 1 h recording (dash line); scale bars represent 5 ms and 0.5 mV, respectively.

