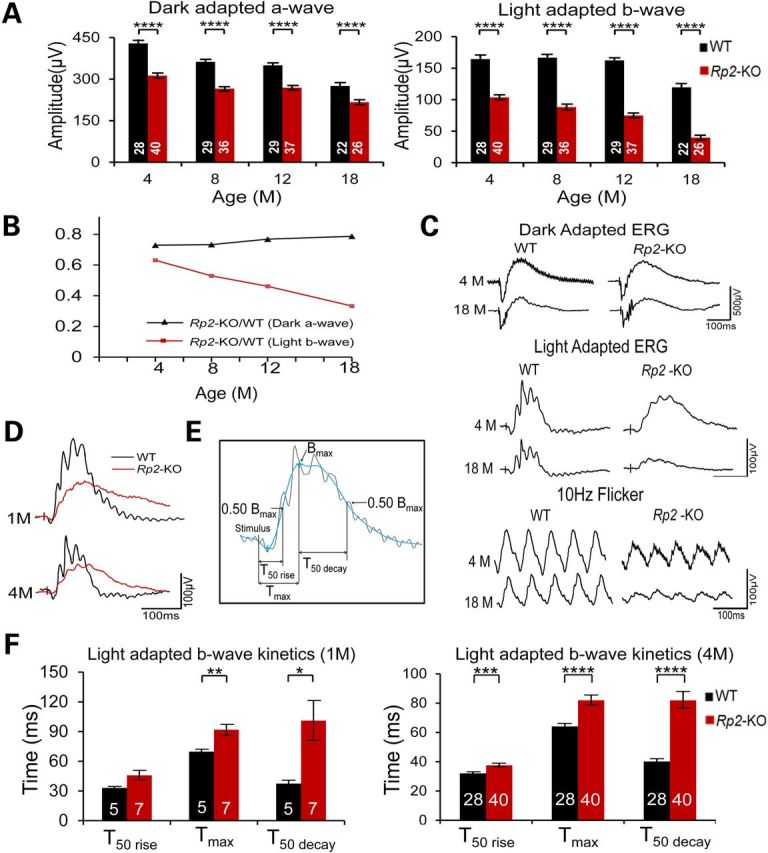
Figure 1.

Progression of photoreceptor dysfunction in Rp2-KO mice. (A) ERG of Rp2-KO mice and their WT littermates over an 18-month period. The stimulus intensities for dark- and light-adapted ERGs were −4.0 to 3.0 and −1.0 to 2.0 log cd s/m2, respectively. Only the amplitudes with the highest flash stimuli are shown. The ERG response with a full range of flash stimuli is shown in the Supplementary Material, Figure S2. Significantly reduced amplitudes of dark-adapted a- (left penal) and light-adapted b-wave (right panel) were observed in Rp2-KO mice, starting from 4 months of age and through the entire duration. (B) The ratio between KO and WT of dark-adapted a-wave and light-adapted b-wave over the 18-month period. The ratio for light-adapted b-wave decreased at a nearly constant rate, whereas that for dark-adapted a-wave remained stable during 4–18 months of age. (C) Representative ERG traces including 10 Hz flicker at 4 and 18 months from one KO mouse and one WT littermate. (D) Overlay of light-adapted b-waves from an Rp2-KO and a WT mouse. (E) Illustration of the parameters used to characterize the kinetics of the light-adapted b-wave. T50 rise refers to the time from the stimulus onset to the 50% of the peak amplitude in the rising phase. Tmax refers to the time from the stimulus onset to the peak amplitude, same as b wave implicit time. T50 decay refers to the time from the peak amplitude to 50% of the peak amplitude in the falling phase. Calculations were based on filtered ERG trace shown in blue. The original ERG trace is shown in black. (F) Comparison between Rp2-KO and WT mice for light-adapted b-wave kinetics at 1 and 4 months. In addition to a significantly prolonged implicit time, the KO mice exhibit a much slower kinetics of the b-wave falling phase. In (A) and (F), the number of mice tested in each group is indicated by white lettering inside each bar. Data from WT and KO mice were compared by two-tailed unpaired t-test and represented as mean ± SEM. *P < 0.05, **P < 0.01, ****P < 0.0001.
