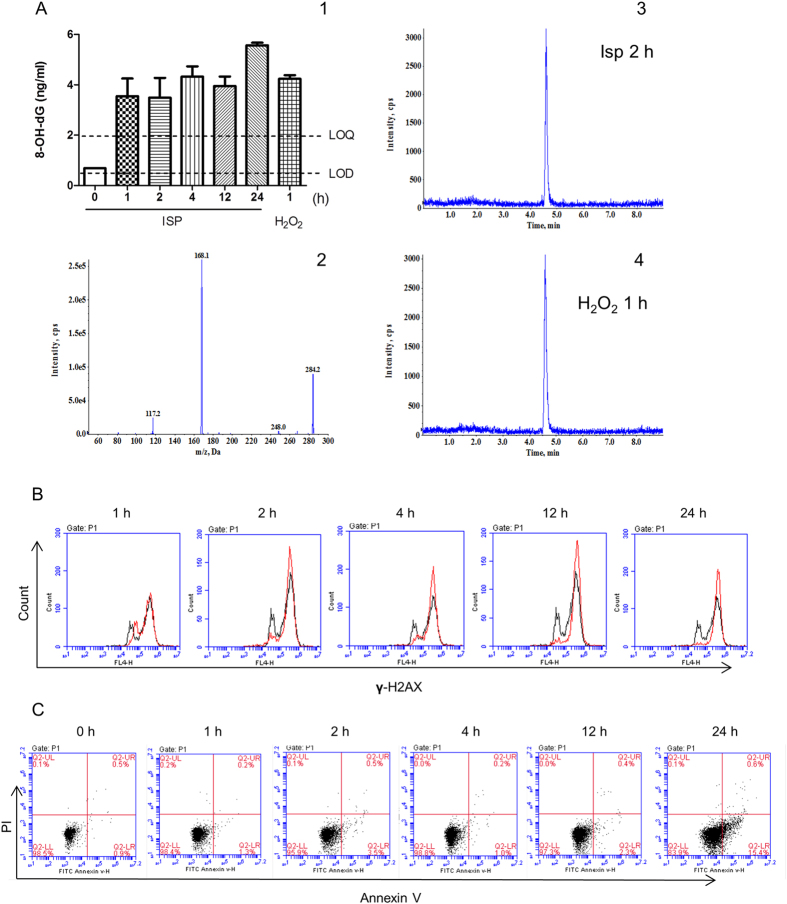
Figure 2. Time kinetic analysis of adrenergic stimulation-induced embryonic pluripotent cell DNA damage and apoptosis.
(A) Increase of 8-OH-dG in ES cells induced by isoprenaline compared with the vehicle administrated control group assayed by LC-MS/MS (A1). Concentrations are expressed as means ± SEM of three independent experiments in triplicate samples. Where error bars are not shown, they lie within the dimensions of the symbol. The amount of 8-OH-dG in ES cells without treatment was below the limit of quantitation (LOQ), 2.0 ng/ML, but above the limit of detection (LOD), 0.5 ng/ML. Collision-induced dissociation (CID) mass spectra of 8-OH-dG are shown (A2). The most abundant and specific product ion was selected for multiple reaction monitoring (MRM) transition: m/z 284.2.0 [M + H] + → 168.1. Representative MRM chromatograms are shown for 8-OH-dG in the cells 2 h after isoprenaline treatment (A3) and 1 h after 100 μM H2O2 treatment (A4). The treatment with H2O2 was used as the positive control for the induction of 8-OH-dG. The method for the identification and quantitation of 8-OH-dG by LC-MS/MS is described in Material and methods. 8-OH-dG, 8-hydroxy-2′-deoxyguanosine. (B) Increase of γ-H2AX positive cells induced by isoprenaline in ES cells assayed by flow cytometry. A total of 10,000 cells was analyzed per sample. Black lines, control cells; red lines, isoprenaline treated cells. Isoprenaline was used at 10 μM for indicated duration. (C) Increase of Annexin V positive cells induced by isoprenaline in ES cells assayed by flow cytometry. A total of 10,000 cells was analyzed per sample. Isoprenaline was used at 10 μM for indicated duration.

