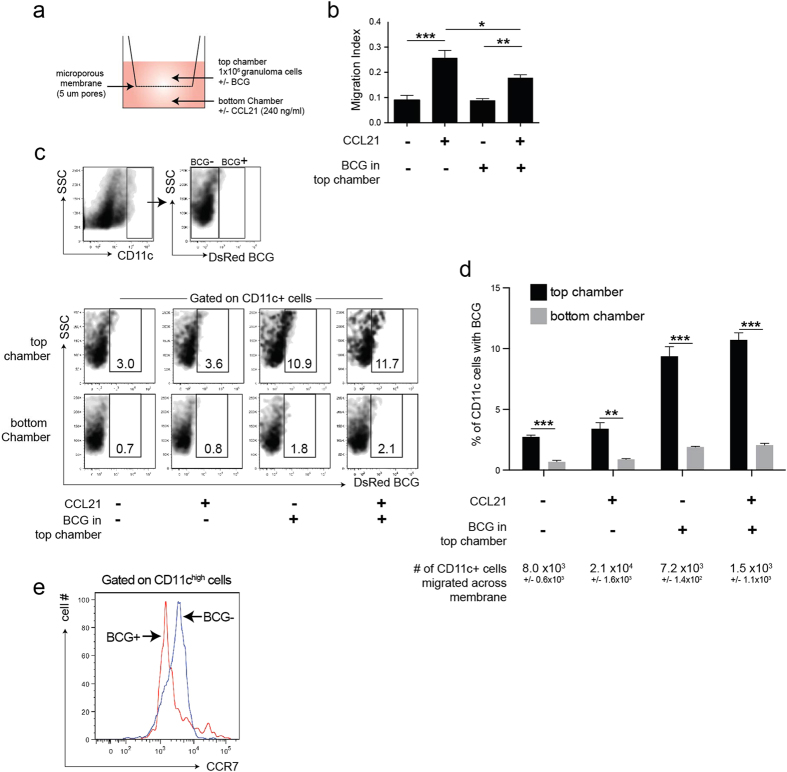
Figure 4. Decreased migration of BCG-infected dendritic cells.
(A) Schema of migration assay. 1 × 10⁶ granuloma cells were loaded into the top chamber of a 5 μm microporous membrane and cells that migrated through into the bottom chamber after 24 hours were collected. Bottom chambers contained media alone or CCL21 (240 ng/ml), top chambers contained granuloma cells alone or granuloma cells+ 2 × 10⁴ BCG bacilli from fresh culture. (B) Migration index of CD11c+ cells, measured as the proportion of cells that migrated across the barrier and into the bottom chamber after 24 hours. (C) Top panels: Flow cytometry plots showing the gating and identification of uninfected, or BCG-infected CD11c+ cells. Bottom panels: representative flow cytometry plots showing the proportion of BCG-infected (CD11c+ DsRed+) cells in the top and bottom chambers after 24 hours. (D) Quantification of data from C. (E) CCR7 expression on CD11c+ DsRedBCG+ and CD11c+ DsRedBCG- cells isolated from acute BCG granulomas. The data show the preferential migration of uninfected CD11c+ cells across the barrier. Error bars mean +/− s.e.m. Student’s t-test (D) and One-way ANOVA (B) used to determine statistical significance. *P < 0.05; **P < 0.01; ***P < 0.001.

