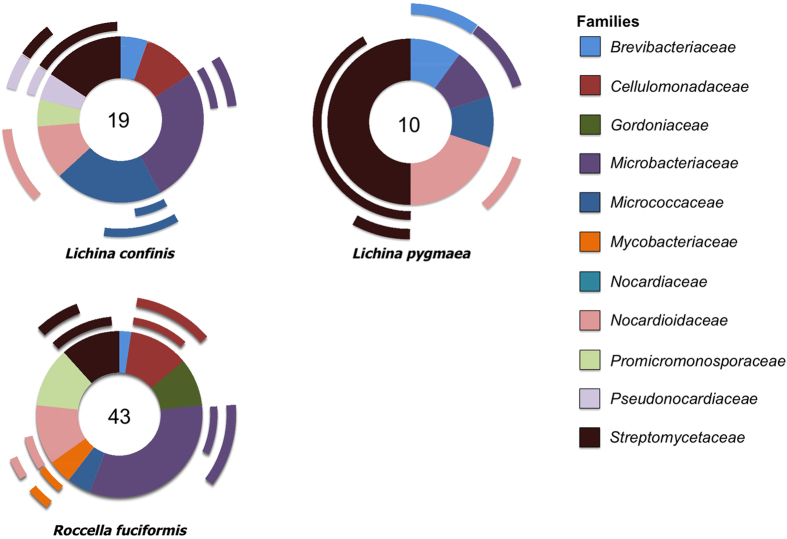
Figure 3. Doughnut charts showing proportions of actinobacterial OTUs observed in each family from the three different marine/maritime lichens studied.
The two levels of ripples around the doughnuts represent the percentage of OTUs that were positive for genes coding the polyketide synthases. The inner ripple represents type I whereas the outer shows type II. Total number of strains are shown in the center of the doughnuts.

