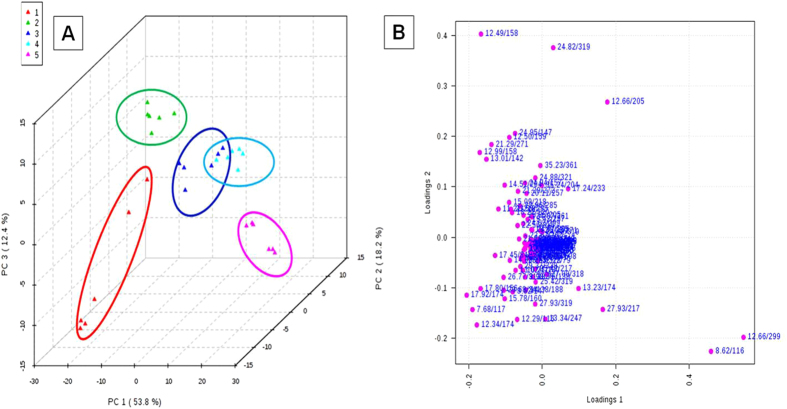
Figure 3.
(A) Principal component analysis (PCA) scores plot of PC1 (first principal component) vs PC2 (second principal component) vs PC3 (third principal component) for Metaphire posthuma extracts showing the separation of (1) control worms, and exposed worms at concentrations of (2) 2.5 mg/kg, (3) 5 mg/kg, (4) 10 mg/kg, (5) 20 mg/kg. (B) Loadings plot for PC1 and PC2 showing the metabolites (rt/m/z) that were major contributors to the separation of groups observed in PCA score plot of earthworm Metaphire posthuma tissue extract.

