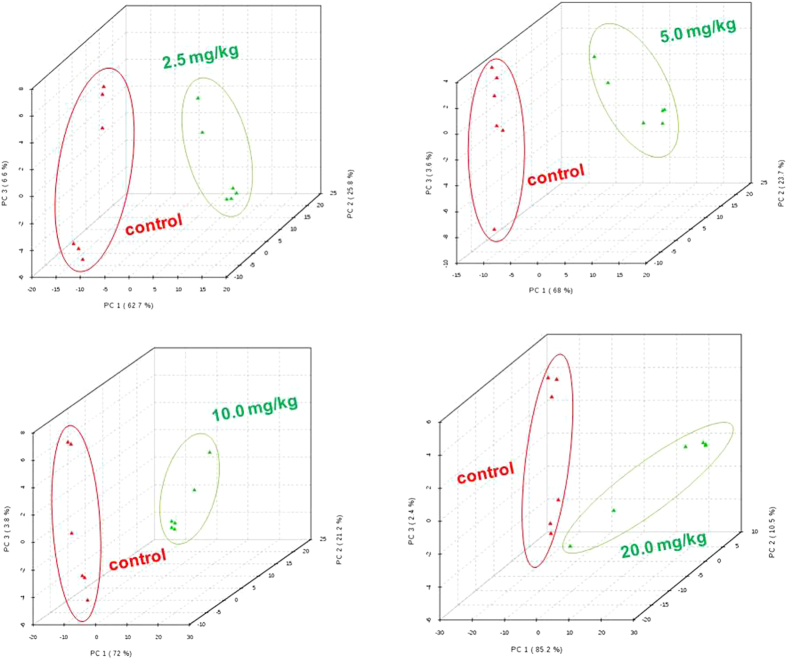
Figure 4.
PCA scores plots of PC1 (first PCA component) versus PC2 (second PCA component) versus PC3 (third PCA component) for GC-MS spectra of the extract of the Metaphire posthuma tissue extracts showing the separation of control worms from exposed worms after cypermethrin exposures of (A) 2.5 mg/kg, (B) 5.0 mg/kg, (C) 10.0 mg/kg (D) 20.0 mg/kg for fourteen days.

