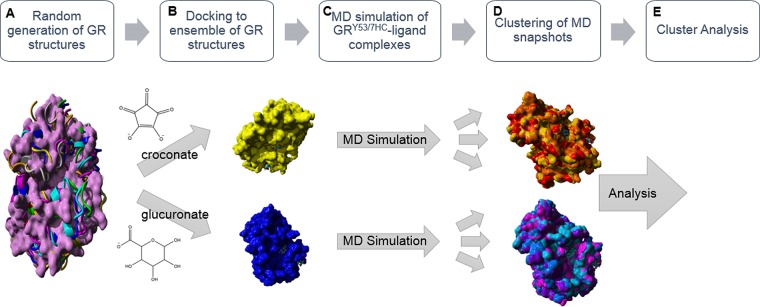
Figure 5.
Computational workflow used to rationalize the differential fluorescence pattern of croconate and glucuronate binding to GR. (A) A ∼20 ns MD simulation using the YAMBER3 force field,19 a derivative of AMBER,20 was performed on the unliganded form of GR to relax the structure. The low energy structure from the MD simulation was then subjected to the CONCOORD algorithm, as described by de Groot et al.,21 to sample conformational space of the GR structure. (B) Croconate and glucuronate were docked to an ensemble of the original unliganded GR crystal structure and eight CONCOORD generated structures using AutoDock VINA.22 These two ligands selected distinctly different conformations for the top-docked form. (C) The 7HC ring was built into the croconate and glucuronate associated GR structures to generate the GRY53/7HC mutant in silico. A ∼15 ns MD simulation using the YAMBER3 force field19 was then performed on each of the GRY53/7HC–ligand complexes. (D) Clustering of the MD snapshots was performed using the method of Pettersen et al.23 (Method S5), which generated representative forms of the enzyme–ligand complexes from the MD simulation. (E) The low energy structure from the MD simulation, the time averaged structure from the MD simulation, and top representative clustered forms of the MD snapshots were used in a variety of surface area analyses. Molecular graphics created with YASARA (www.yasara.org) and POVRay (www.povray.org).

