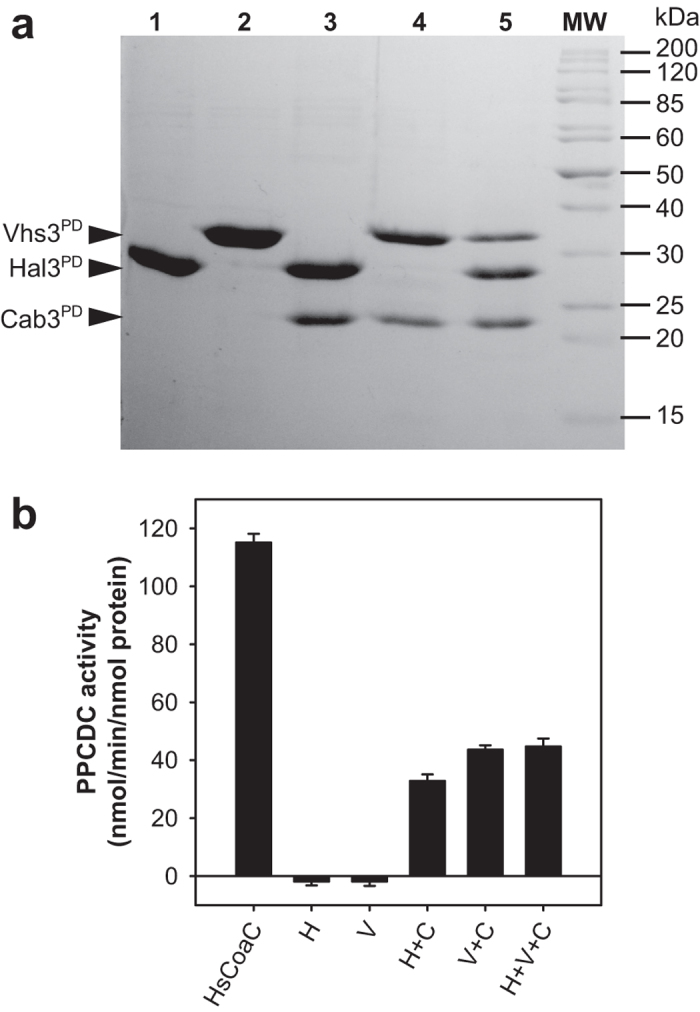
Figure 3. SDS-PAGE and PPCDC activity analyses of purified PD proteins.

(a) SDS-PAGE analysis (using a 12% gel) of ~5 μg of each of the pure PD proteins or the indicated mixtures. Lane 1, 6 × His-Hal3PD (expected MW: 29.1 kDa); lane 2, 6 × His-Vhs3PD (expected MW: 34.5 kDa); lane 3, co-expressed 6 × His-Hal3PD/Cab3PD (expected Cab3 MW: 23.3 kDa); lane 4, co-expressed 6 × His-Vhs3PD/Cab3PD; lane 5, co-expressed 6 × His-Hal3PD/6 × His-Vhs3PD/Cab3PD; MW, molecular weight markers with molecular weights indicated. (b) In vitro PPCDC activity of ~60 nM of either HsCoaC, Hal3PD (H), Vhs3PD (V), Hal3PD/Cab3PD (H + C), Vhs3PD/Cab3PD (V + C), and co-expressed Hal3PD/Vhs3PD/Cab3PD (H + V + C). The data represent the average of three separate experiments, with the error bars showing the standard deviation.
