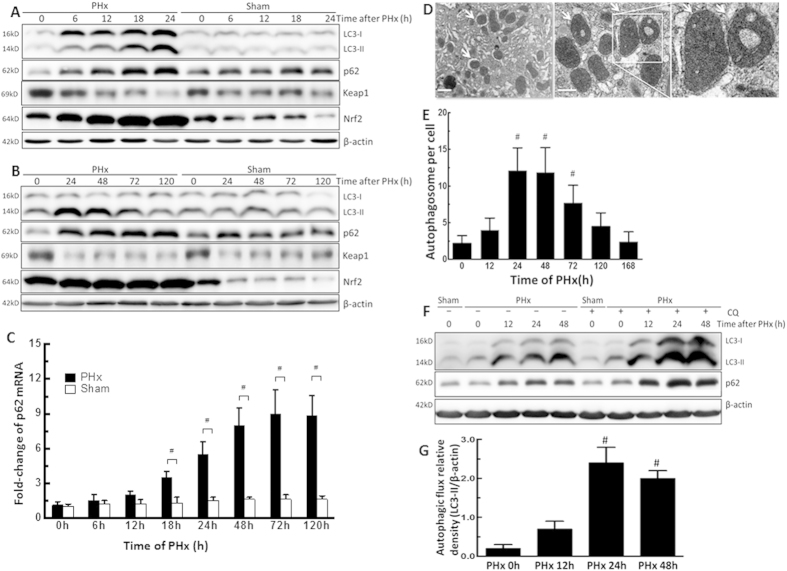
Figure 1. PHx induced autophagy and increased autophagic flux in the early phase of liver regeneration.
Wild-type mice were treated with PHx or a sham operation and then sacrificed at 0–168 h after surgery. (A,B) Liver tissues were harvested, and tissue extracts were analyzed for LC3-II, p62, Keap1, Nrf2, and β-actin protein levels at each time point by Western blotting. (C) Fold-change in p62 mRNA expression. (D) Electron microscopic images of autophagosomes in the liver regeneration. Arrows indicate autophagosomes with double-membrane structures containing with mitochondria or cytosolic contents. Scale bar, 1 μm. (E) The number of autophagosomes in hepatocytes at the different time points. (F,G) Wild-type mice were intraperitoneally injected with or without chloroquine (CQ) at 0.5 h before either the sham operation or PHx and then once per day until 48 h. Liver tissues were harvested at 0 h, 12 h, 24 h, and 48 h after surgery, and tissue extracts were analyzed for LC3-II, p62, β-actin and autophagic flux. Autophagic flux was quantified by subtracting LC3-II levels in mice without additional CQ treatment from the LC3-II levels in mice with additional CQ treatment. The 0 h-PHx condition without CQ treatment was set to represent an autophagic flux of 100%. The values are shown as the mean ± SD in the bar graph and compared by Student’s t test. #P < 0.05 versus 0 h-treated PHx (n = 6).

