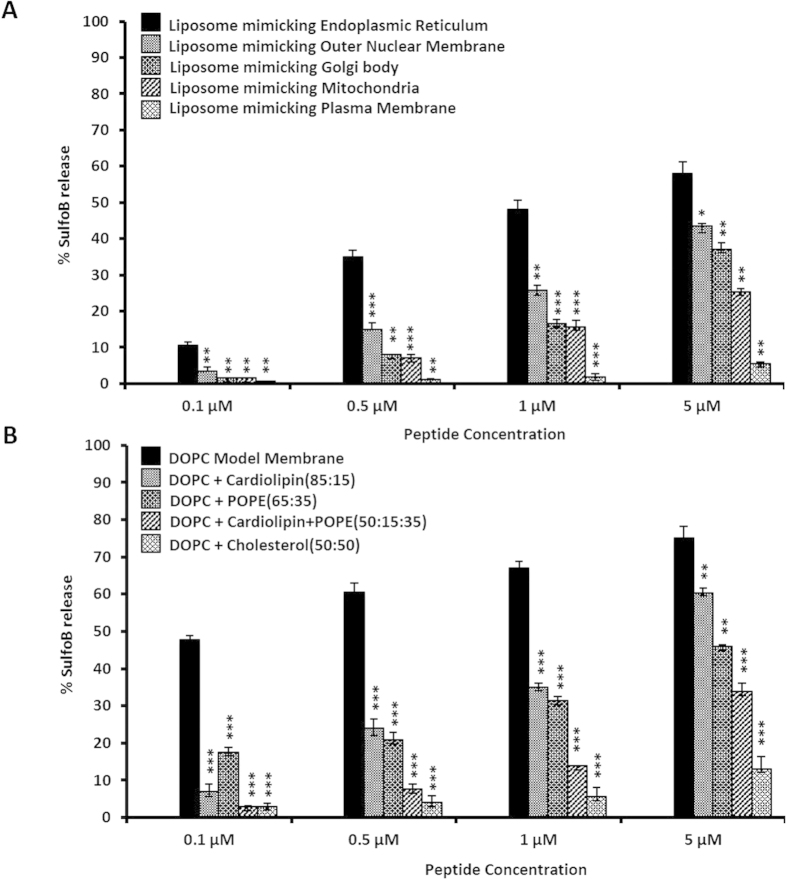
Figure 2.
(A) Disruption of liposomes mimicking the membranes of cellular organelles by the 2B peptide. Data are represented as the mean of the results for triplicate independent samples ± the standard deviation (SD). ***P < 0.001; **P < 0.01; *P < 0.05 (Student’s t test in comparison with results for rhodamine dye release in endoplasmic reticulum) (B) Disruption of liposomes composed of different combinations of DOPC, cholesterol, POPE and cardiolipin by the 2B peptide. Data are represented as the mean of the results for triplicate independent samples ± the standard deviation (SD). ***P < 0.001; **P < 0.01; *P < 0.05 (Student’s t test in comparison with results for rhodamine dye release in DOPC liposome).

