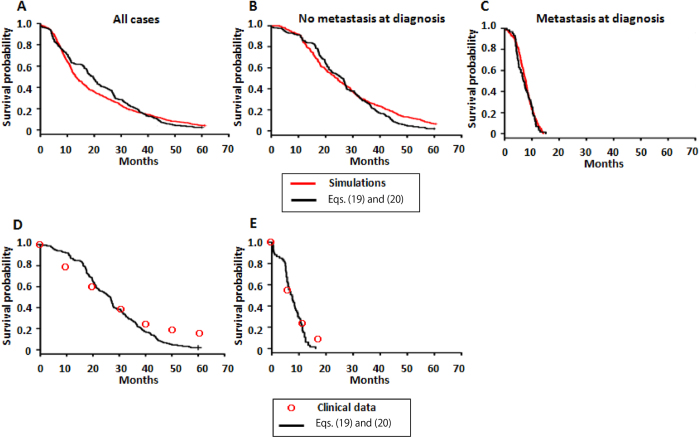
Figure 7. Overall survival based on computational simulations, theoretical predictions, and clinical data.
Survival analyses comparing theoretical predictions (black lines, Eqs. (19) and (20)) and computational simulations (red lines) in cases of (A) the entire cohort, (B) those without, and (C) with diagnostic metastases. The numbers of simulation trials in simulations and equations are (A) 211 and 413, (B) 256 and 153, (C) 160 and 67, respectively. P values were (A) 0.506, (B) 0.201, and (c) 0.544, respectively. Panels D and E show a comparison of survival between the theoretical predictions and clinical data from the literature28,29 ((D) Oshima et al., 2013, (E) Cunningham et al., 2009). Parameter values used in theoretical predictions and computational simulation are based on the estimations in the autopsy program; r = 0.11, d = 0.01r, a1 = 0.16, b1 = 0.01a1, a2 = 0.24, b2 = 0.01a2, a3 = 0.58, b3 = 0.01a3, u1 = u2 = 6.31×10⁻⁵, q = q′ = 6.31×10⁻⁷, M = 10N(9.47,0.59), and  = 1011.2. Here, N(9.47, 0.59) represents the normal distribution with mean 9.47 and variance 0.59.

