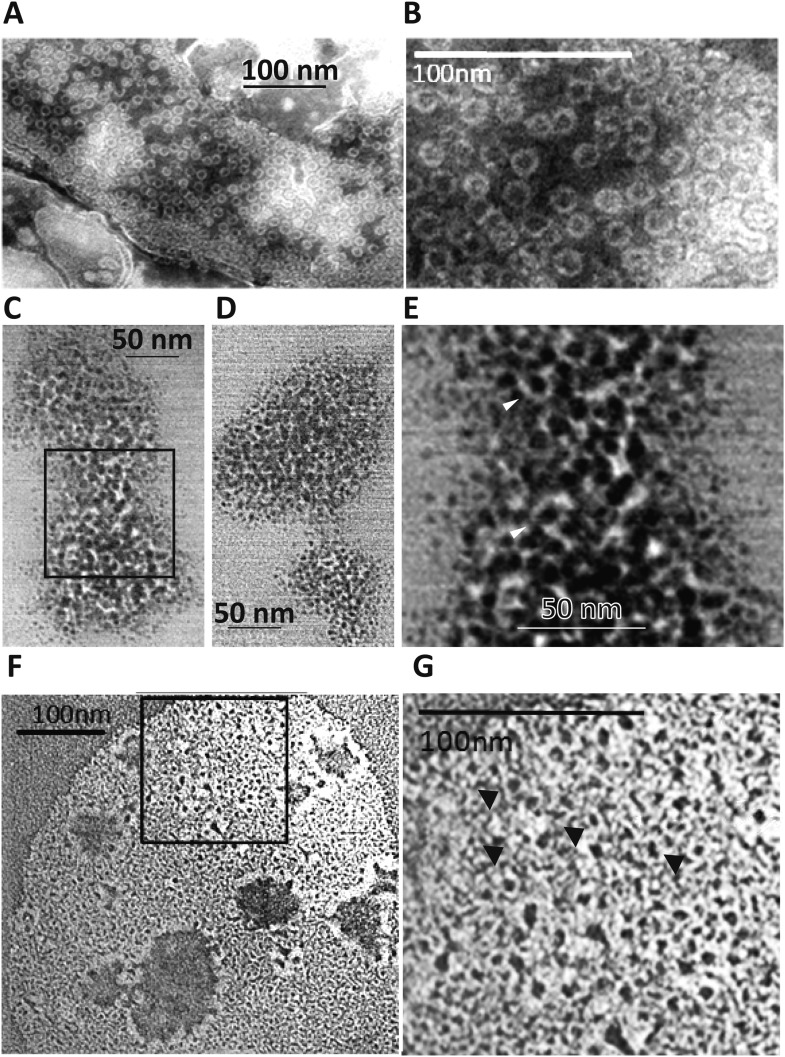
Figure 5. Perforin-2 forms pores in bacterial surfaces after infection and in Perforin-2 overexpressed eukaryotic membranes that are visible by negative stain transmission electron microscopy (TEM).
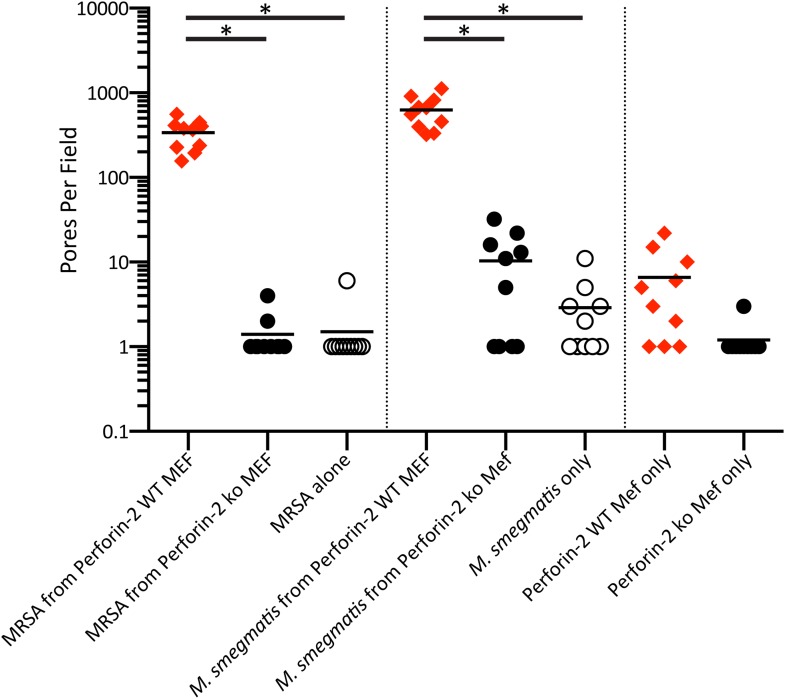
(A, B) Electron micrograph of polymerized Perforin-2 membrane lesions from Perforin-2-GFP transfected HEK-293 cells, with Perforin-2 activated to form pores by trypsin digestion to the enriched membrane fraction. Panel A Demonstrates the quantity of pores on the Perforin-2 overexpressed membranes after trypsin activation. Panel B denotes a higher magnification to illustrate the uniform pore structure. (C-G) Perforin-2 wild-type MEFs were treated with IFN-γ for 14 hr, and infected with (C–E) MRSA or (F, G) M. smegmatis. After 5 hr the infected bacteria were isolated and imaged utilizing negative stain TEM. Arrows point to black, stain-filled pores on the bacterial cell wall surrounded by white, stain excluding borders created by polymerized Perforin-2. Round pores measure 8.5–10 nm inner diameter, the size typical for polymerized Perforin-2-pores. Panels E and G are close-up images of the boxed region in C and F. Blinded quantification of pore amount with different conditions is demonstrated in Figure 6—figure supplement 1.


