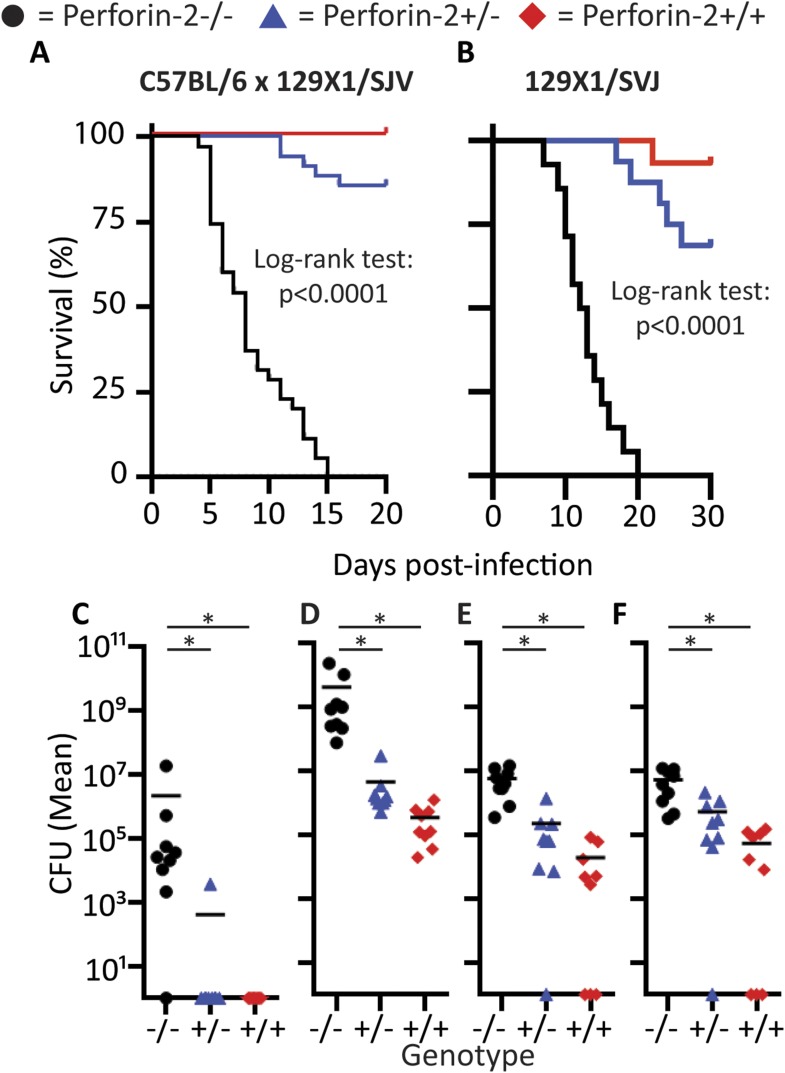
Figure 8. Perforin-2 is required for in vivo survival after orogastric S. typhimurium challenge.
(A) Aggregated survival curves of 70 C57BL/6 × 129 × 1/SJV mice challenged with 105
S. typhimurium. (B) Aggregated survival curves of 45,129X1/SVJ mice challenged with 105
S. typhimurium. (C–F) Organ load five days after 105
S. typhimurium infection in C57BL/6 × 129 × 1/SJV mice in (C) blood, (D) small intestine, (E) liver, and (F) spleen.  = MPEG1 (Perforin-2) wild-type animals (+/+),
  = MPEG1 (Perforin-2) heterozygous animals (+/−), •= MPEG1 (Perforin-2) knockout animals (−/−). Log-rank (Mantel–Cox) test was performed for A and B with statistical significance p < 0.0001. One-way ANOVA with Tukey post-hoc multiple comparisons was performed in C-F. *p < 0.05 as indicated.
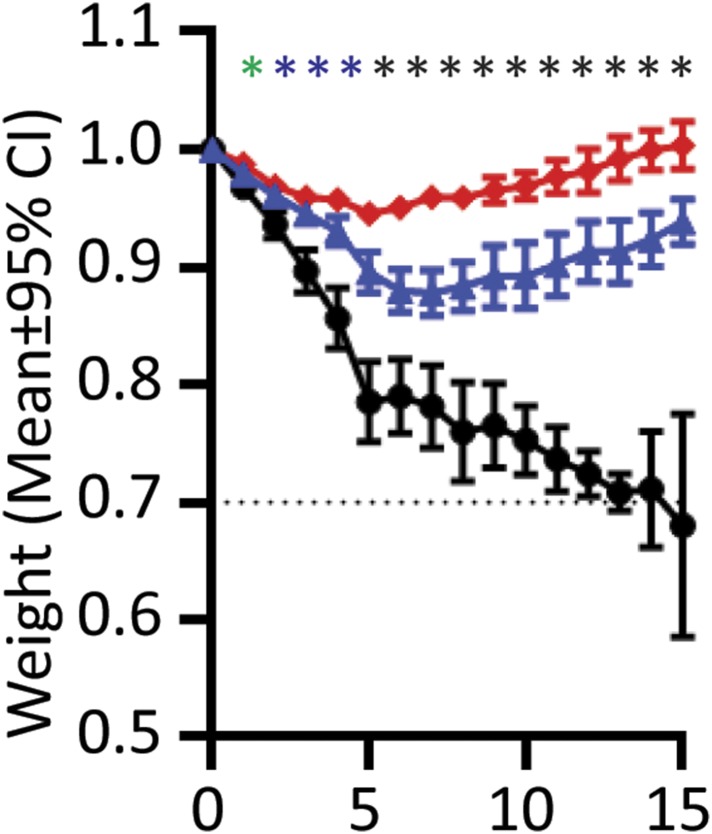
Figure 8—figure supplement 1. Weight loss curves after in vivo orogastric S. typhimurium challenge.
 = MPEG1 (Perforin-2) wild-type (+/+) animals,
  = MPEG1 (Perforin-2) heterozygous (+/−) animals, •= MPEG1 (Perforin-2) knockout (−/−) animals. One-way ANOVA with Tukey post-hoc multiple comparisons was performed with *p < 0.05 between Perforin-2 knockout:Perforin-2 wild-type mice *p < 0.05 between Perforin-2 knockout:Perforin-2 wild-type and Perforin-2 knockout:Perforin-2 heterozygous mice. *p < 0.05 between Perforin-2 knockout:Perforin-2 wild-type, Perforin-2 knockout:Perforin-2 heterozygous, and Perforin-2 heterozygous:Perforin-2 wild-type.


