
Figure S2.
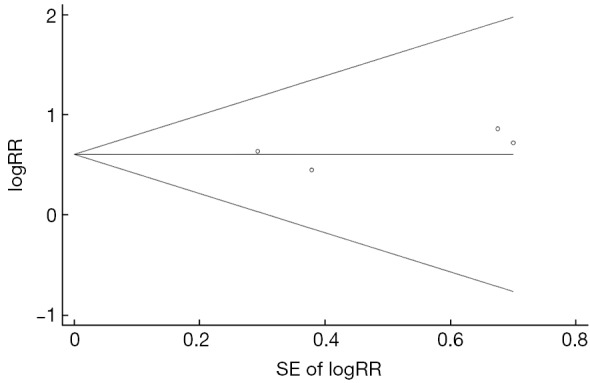
Funnel plot for the association between C1653T and hepatocellular carcinoma risk. SE, standard error; RR, relative risk.
Official websites use .gov
A
.gov website belongs to an official
government organization in the United States.
Secure .gov websites use HTTPS
A lock (
) or https:// means you've safely
connected to the .gov website. Share sensitive
information only on official, secure websites.
Funnel plot for the association between C1653T and hepatocellular carcinoma risk. SE, standard error; RR, relative risk.