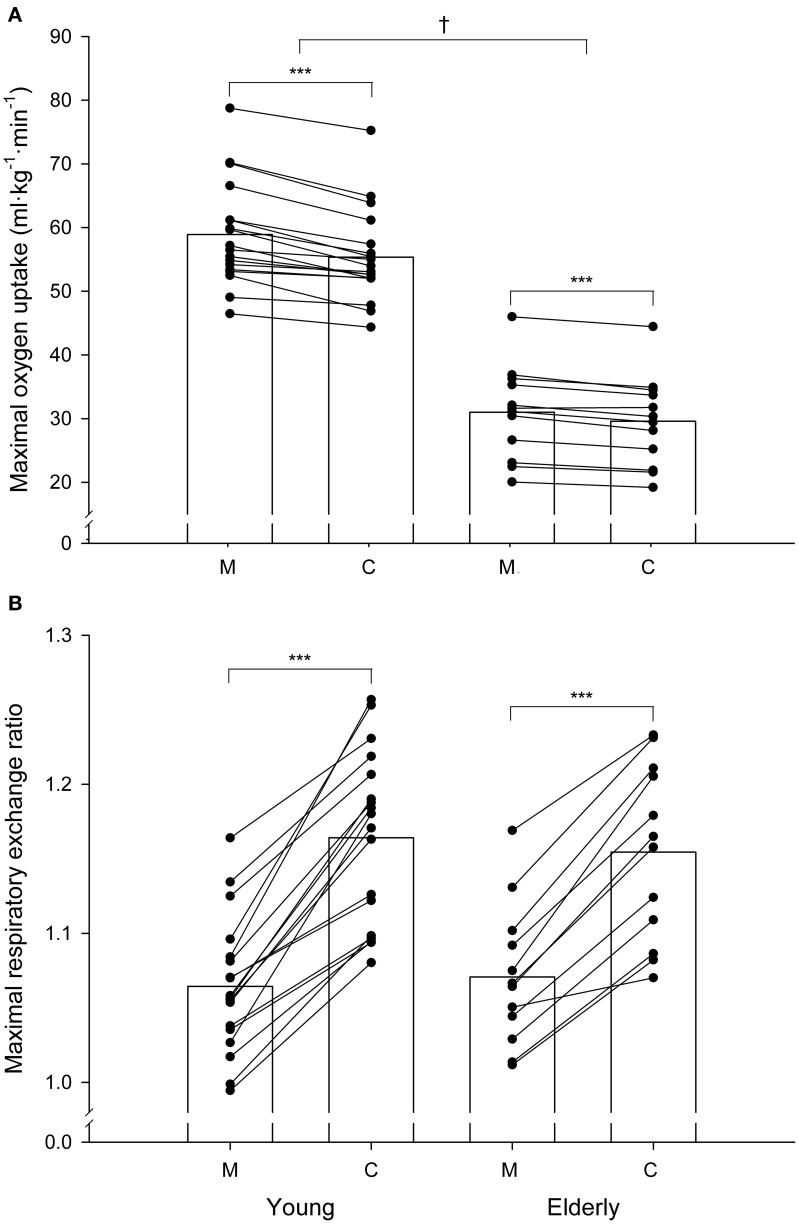
Figure 3.
Individual measured (M) and corrected (C) values of maximal oxygen uptake (A) and maximal respiratory exchange ratio (B) in the young and elderly groups. Maximal oxygen uptake is expressed in ml·kg·min−1. The bars indicate mean values. ***Significant difference between the corrected and the corresponding measured values (P < 0.001). †Significant difference between groups (P < 0.05).

