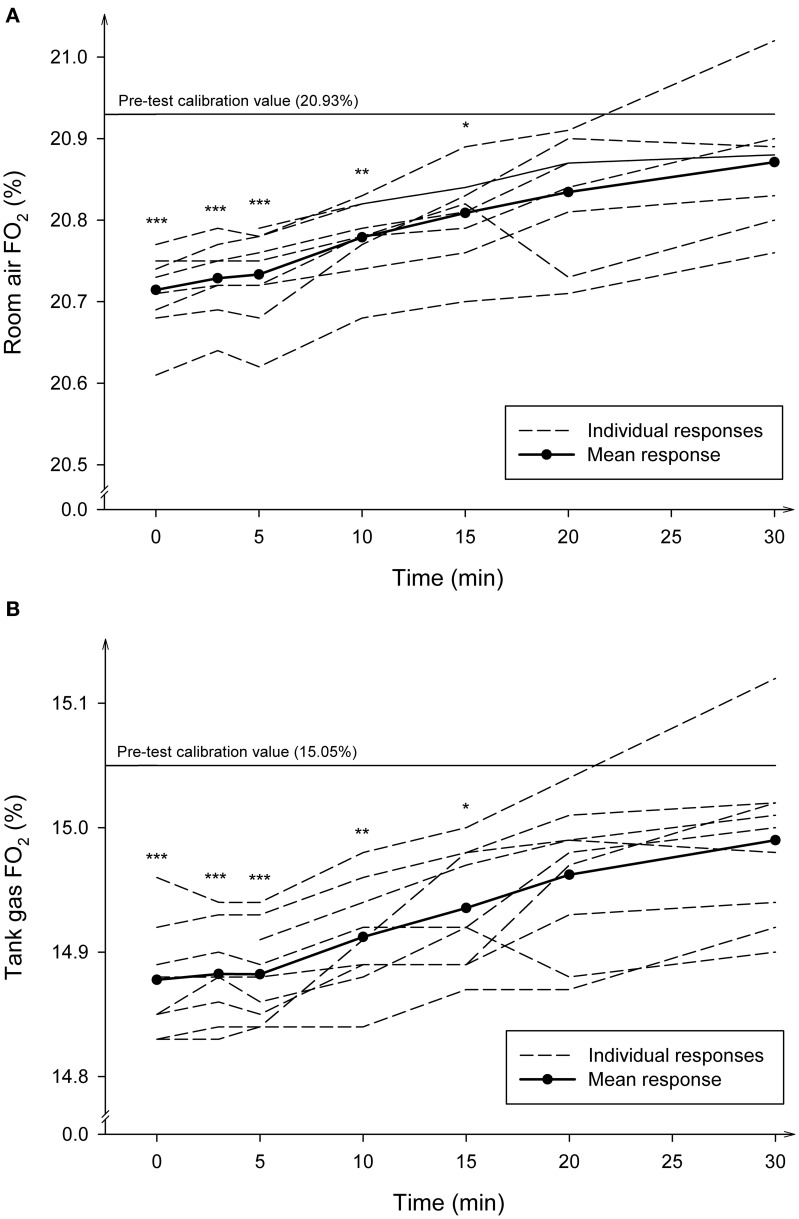
Figure 4.
Average and individual time course of the fractional concentrations of oxygen (FO2) during recovery after maximal exercise. The post-test verification values read by the gas analyzers using the room air (A) and the tank gas (B) were measured at 20 s, 3, 5, 10, 15, 20, and 30 min of recovery. The number of observations made at each time-point was 9. ***Significantly different from pre-test (P < 0.001); **Significantly different from pre-test (P < 0.01); *Significantly different form pre-test (P < 0.05).

