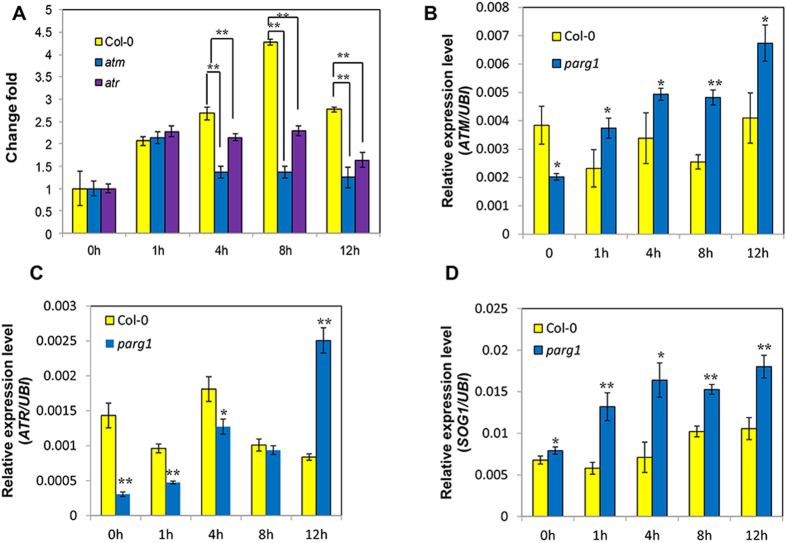
Figure 8. PARG1 expression is regulated by ATM and ATR but it antagonistically represses the expression of DNA damage signaling genes.
(A) Comparison of the induction level of PARG1 in Col-0, atm and atr mutants after bleomycin treatment. The fold lines connect the columns for comparison. (B–D) Comparison of ATM, ATR and SOG1 expression levels in Col-0 and in the parg1 mutant. Seedlings grown for two weeks were treated by 50 μg ml−1 bleomycin for different time periods. The data were presented as means of three replicates ± SE. Significant differences (t-test) are indicated by asterisks: *P < 0.05; **P < 0.01.

