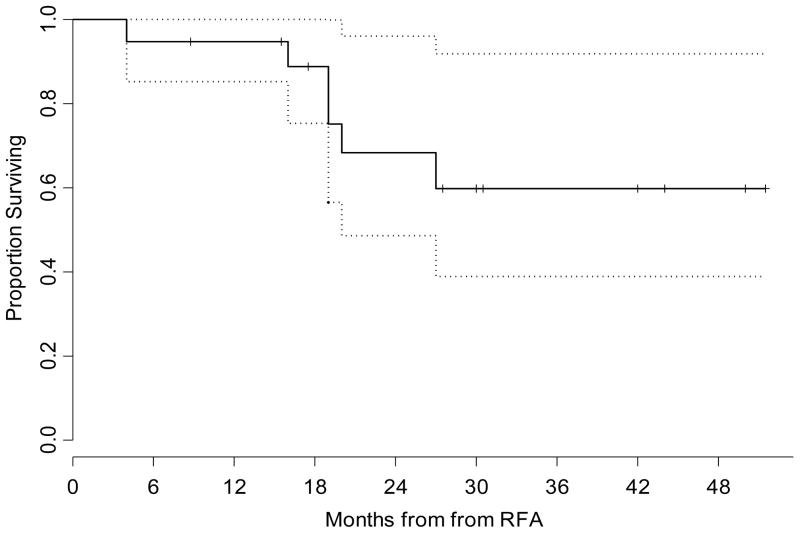
Figure 1.
Kaplan-Meier Plot illustrating the overall survival for the entire group with confidence limits. The time shown is in x axis is in months from RFA. The dotted lines are 95% confidence bands for the probability of overall survival. Reprinted with permission (18).

