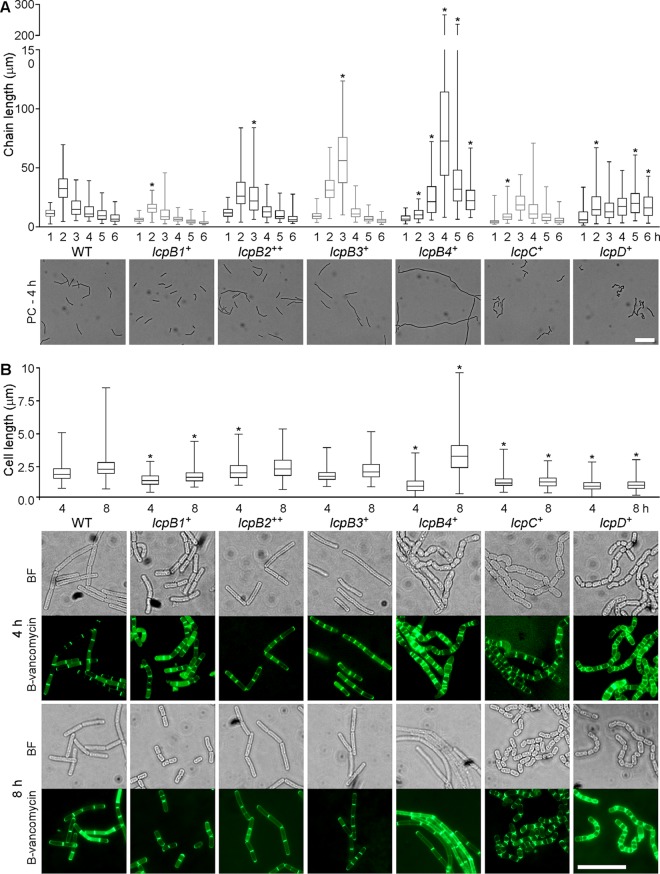
FIG 2.
Chain length and cell length of B. anthracis variants expressing single lcp genes. (A) Aliquots of cultures grown as described for Fig. 1B were removed and fixed at hourly intervals for up to 6 h following inoculation in fresh medium. Images were captured and used to measure the lengths of 100 chains per time point using the ImageJ software. Results are presented in a box-and-whisker plot, where the box denotes the 25th and 75th percentiles, the whiskers denote the minimum and maximum values, and the center bar indicates the median value. Representative phase-contrast (PC) microscopy images from the 4-h time point are shown beneath the plot. The scale bar represents 20 μm. (B) Aliquots of cultures fixed at 4 and 8 h following inoculation in fresh medium were stained with BODIPY-vancomycin (B-vancomycin). The lengths of individual cells (n > 150) were measured using the ImageJ software and are presented in a box-and-whisker plot as in panel A. Representative images from both time points are shown below the plot, with bright-field (BF) microscopy images on top and images of the specimen stained with B-vancomycin below. The scale bar represents 10 μm. Data were analyzed by ANOVA for significant differences compared to the WT at the same time point. *, P < 0.05.

