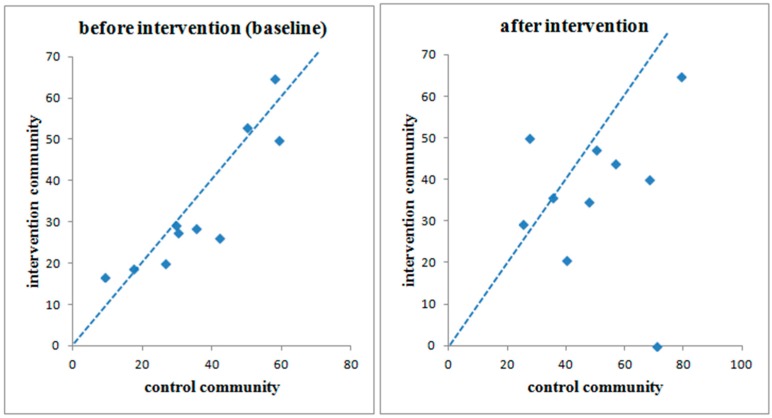
Figure 3.
Diarrhea prevalence in intervention and control communities. If a dot is located below the line of equality, it means the diarrheal prevalence of the control community is higher than that of its counterpart in the pair. After the intervention, diarrheal prevalence fell much farther below the line of equality.

