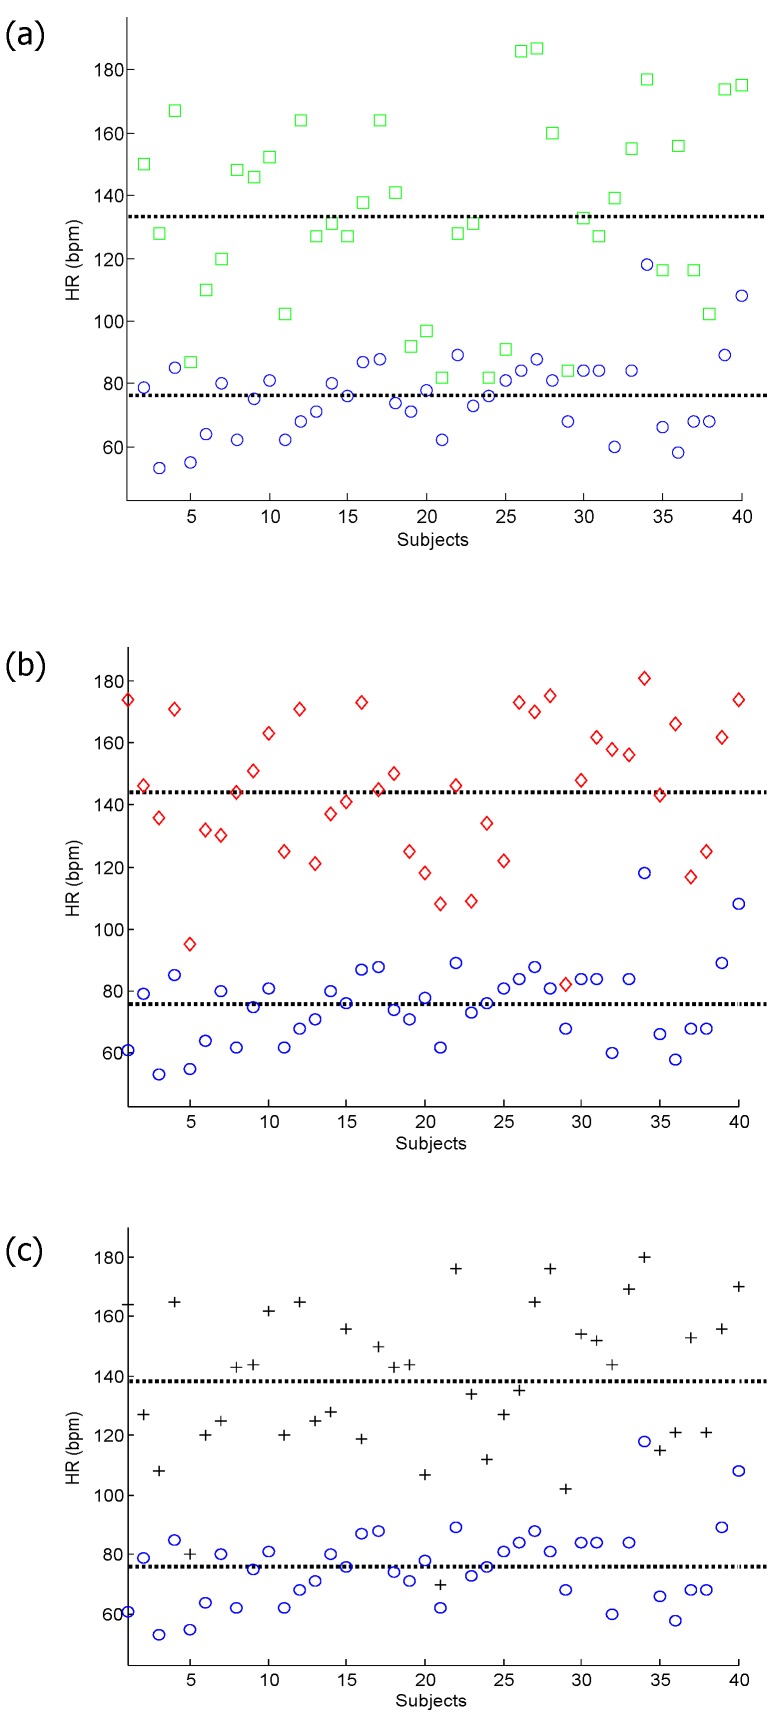
Figure 2.
Analysis of the heart rate. (a) Heart rate for subjects measured before the simulated heat stress induction (at rest (blue circles)) against those measured after the first simulated heat stress induction (Exercise 1 (green squares)); (b) heart rate for subjects measured at rest against those measured after the second simulated heat stress induction (Exercise 2 (red diamond)); (c) heart rate for subjects measured at rest against those measured after the third simulated heat stress induction (Exercise 3 (black pluses)).

