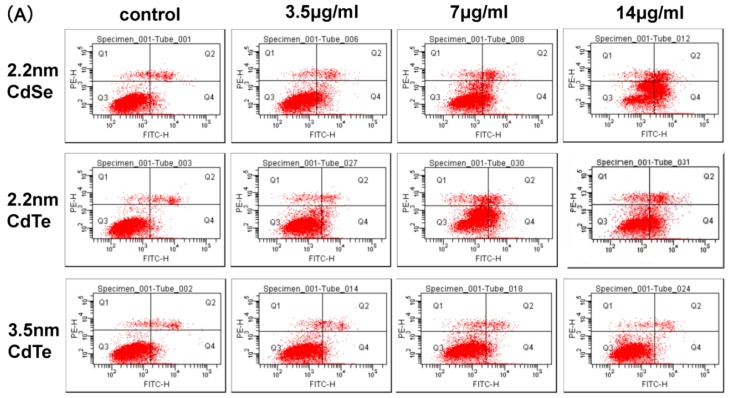
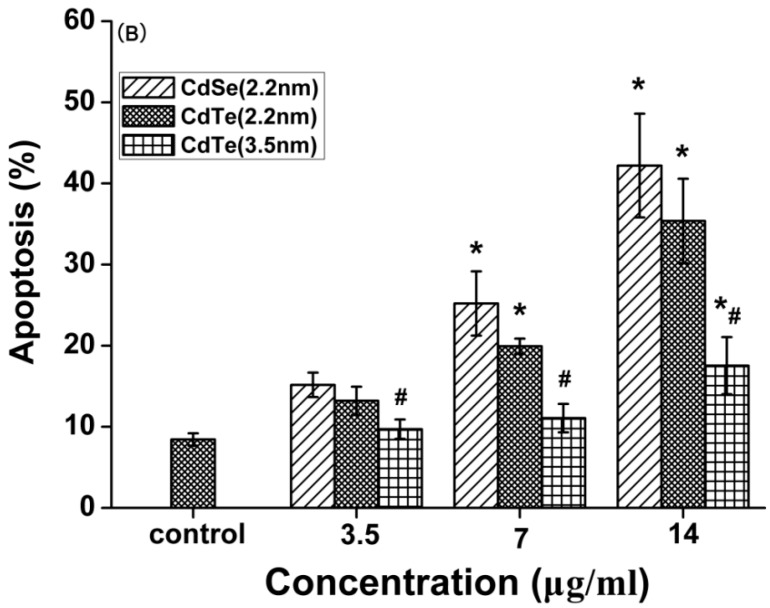
Figure 7.
The analysis of the apoptosis in the cells. (A) Flow cytometric evaluation of the effect of three types of QDs on L929 mouse fibroblasts apoptosis and necrosis after 24 h of treatment with 3.5, 7, and 14 μg/mL CdTe QDs. Cells were stained using an apoptotic detection kit (PI/annexin V-FITC). Quadrant (Q)1 shows the percentage of necrotic cells (PI positive cells), Q2 shows the percentage of cells of late apoptotic phase (Double positive cells), Q3 shows the percentage of normal viable cells and Q4 shows the percentage of early apoptotic cells (annexin V-FITC positive cells); (B) shows the percentage of apoptosis cell in the early and late stages (Q2+Q4). Data are the mean ± SD of three separate experiments. Significance was indicated by: * p < 0.05 vs. control cells. # p < 0.05 vs. 2.2 m CdTe QDs.


