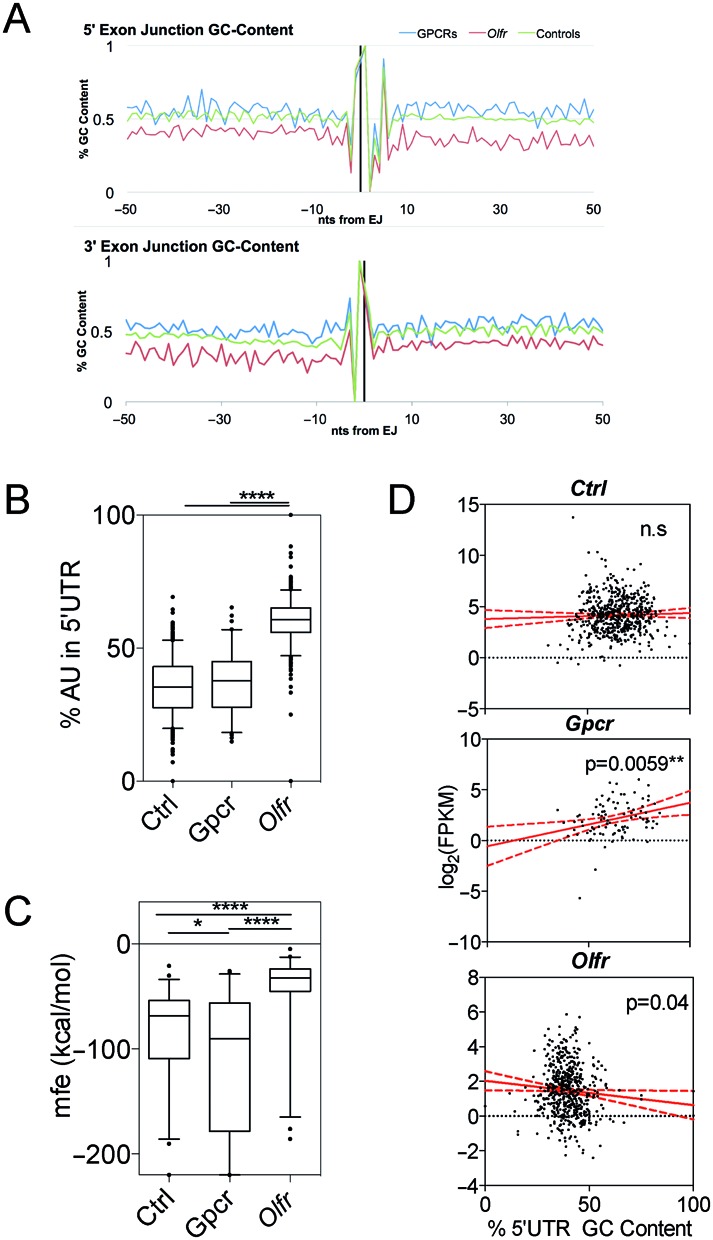
Figure 4.

Olfr mRNAs are AU-rich. (A) GC-content along exon-intron junctions (top) and intron-exon junctions (bottom). (B) Boxplot of% of AU-content in the 5′ UTR. (C) Boxplot of minimal free energy (mfe) in the 5′ UTR. (D) Scatterplot and linear regression analysis of expression level versus 5′ UTR% GC-content. * P < 0.05; ** P < 0.01; **** P < 0.0001; n.s., not statistically significant.
