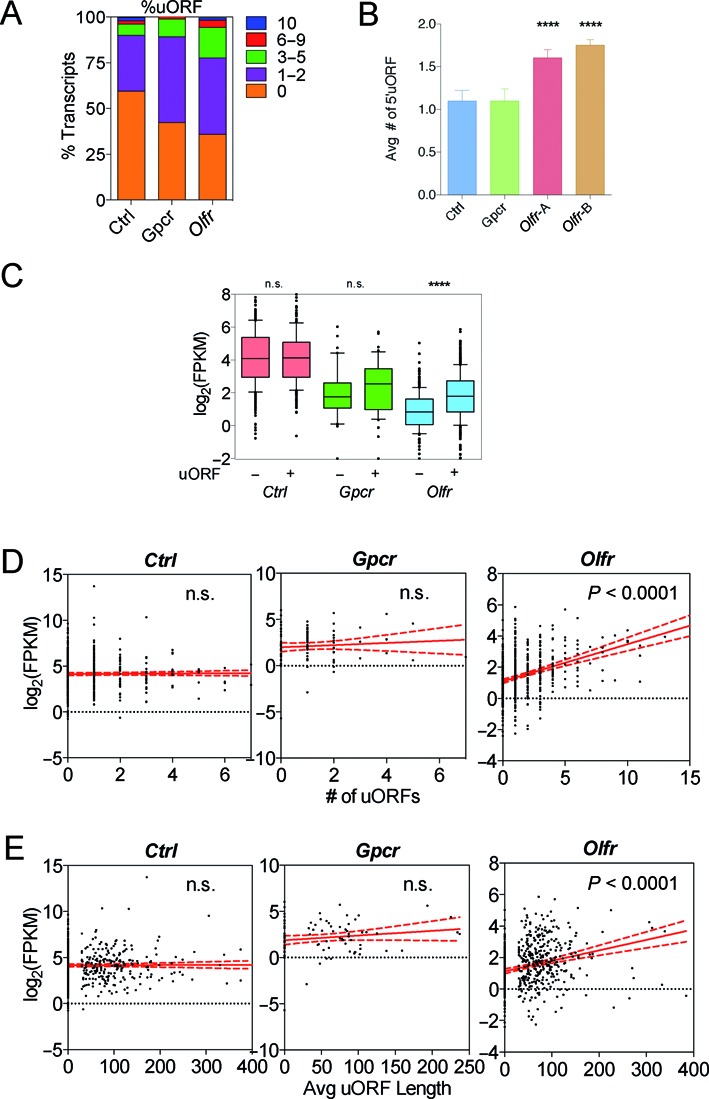
Figure 6.

Olfr mRNAs are uORF-rich. (A) The percentage of transcripts from the three groups with the indicated number of uORFs. (B) The average number of uORFs. (C) Box plot comparing the expression level of transcripts harboring or lacking uORFs from the three groups. (D) Scatterplot and linear regression analysis of expression level versus uORFs density. (E) Scatterplot and linear regression analysis of expression level versus average uORF length. **** P < 0.0001; n.s., not statistically significant.
