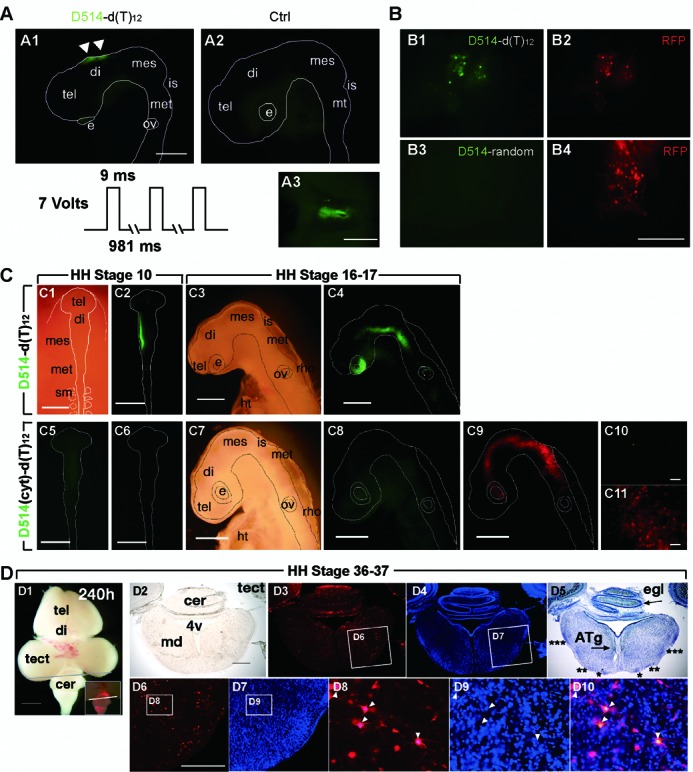
Figure 8.

In vivo imaging of poly(A) RNA in living chick embryos. (A) Micrographs of the head region of a developing chick embryo after in ovo electroporation of D514-d(T)12. A1: fluorescence observed in the diencephalon region between the electrodes following electroporation; A2: low fluorescence background was observed when D514-d(T)12 was injected into the neural tube but no current pulses were applied; A3: dorsal view of the fluorescent region after the chick brain was dissected into phosphate saline buffer (PBS). (B) CAG-RFP was co-electroporated either with D514-random or with D514-d(T)12 into the diencephalon region. After 4 h to allow fluorescent protein expression, red fluorescence expressing cells also contained D514-d(T)12 activity, while almost no D514-random fluorescence was observed regardless of RFP expression. (C) Top row, bright field (C1, 3) and fluorescent views (C2, 4) of a developing chick embryo electroporated with D514-d(T)12 at HH stage 10, observed at HH stages 10 (C1, 2) and 16–17 (24 h later than HH stage 10; C3, 4). Bottom row, bright field (C7) and fluorescent views (C5, 6, 8–11) of a developing chick embryo electroporated with D514(cyt)-d(T)12 and CAG-RFP DNA plasmids at HH stage 10. C6, C8: D514 fluorescence; C6, C9, C11: RFP fluorescence. (D) Bright-field and fluorescent views of a developing chick embryo at HH stage 36–37, 240 h after electroporation. D1: ventral view of the chick embryo; the line indicates the position of the cryosection slice viewed in D2–10. D2: bright field; D3: RFP fluorescence (red); D4: DAPI (blue); D5: nissl staining (blue); D6–9: magnified images of the boxed areas in D3, D4; D10: an overlaid image of D8 and D9. tel: telenchephalon, di: diencephalon, mes: mesencephalon, is: isthmus, met: metencephalon, rho: rhombencephalon, e: eye, ov: otic vesicle, sm: somite, ht: heart. Scale bars: 500 μm (A1, B4, C1–9), 100 μm (A3, C10, 11, D6).
