
Figure 5.
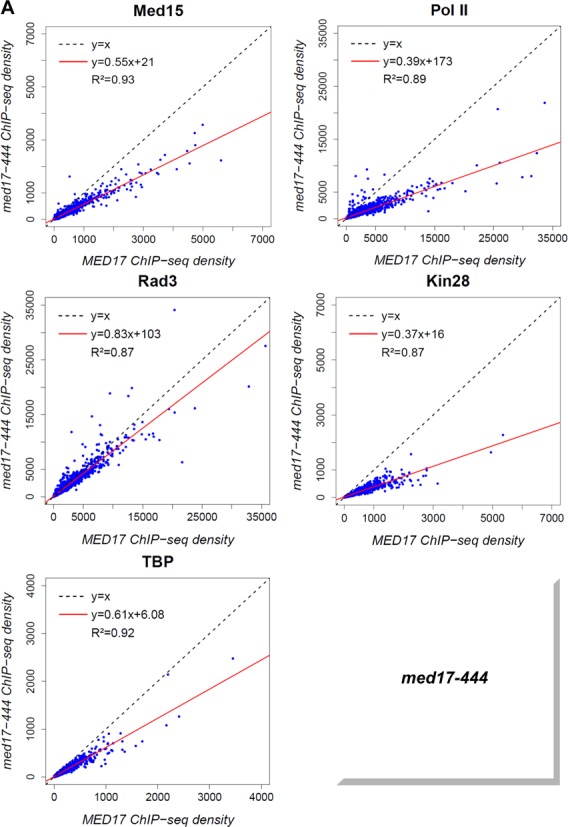
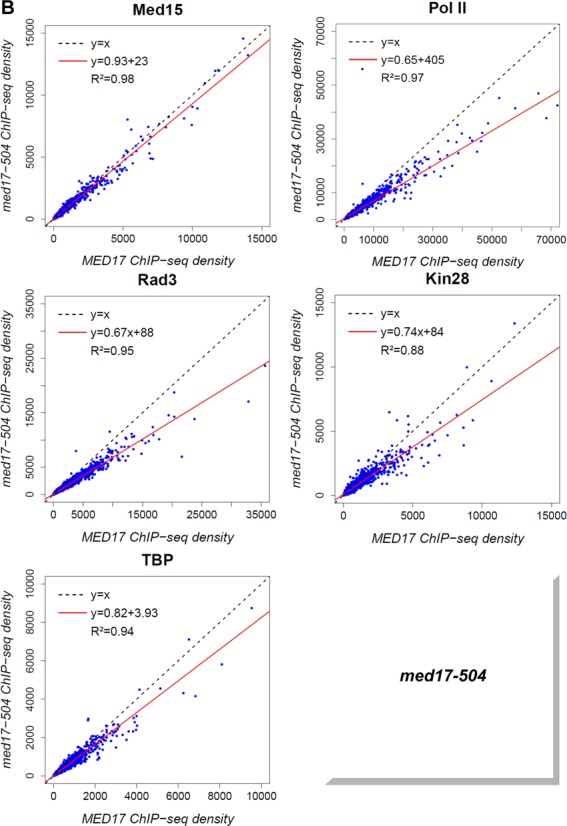
Global destabilization of PIC assembly in med17-444 and -504 mutant strains. The density of sequence tags in Med15, Rad3, Kin28 and TBP ChIP-seq experiments was calculated for promoter regions of Pol II-transcribed genes. Cells were grown at 30°C in YPD medium and then transferred for 45 minutes to 37°C. The density of sequence tags in the Pol II ChIP-seq experiments was calculated for the Pol II-transcribed genes. In all, 3852 Pol II-enriched genes were used for these analyses. Tag densities were normalized relative to qPCR data on a set of selected genes. Each point on the plot corresponds to one promoter region or one ORF. Promoter regions correspond to intergenic regions in tandem or in divergent orientation, excluding intergenic regions encompassing Pol III-transcribed genes. A linear regression (red line) for ChIP-seq density in mutant versus ChIP-seq density in WT and an R2 correlation coefficient are indicated. (A) Med15, Pol II, Rad3, Kin28 and TBP ChIP-seq density in med17-444 versus ChIP-seq density in WT on class II promoter regions or ORFs (for Pol II). (B) Med15, Pol II, Rad3, Kin28 and TBP ChIPseq density in med17-504 versus ChIP-seq density in WT on class II promoter regions or ORFs (for Pol II).