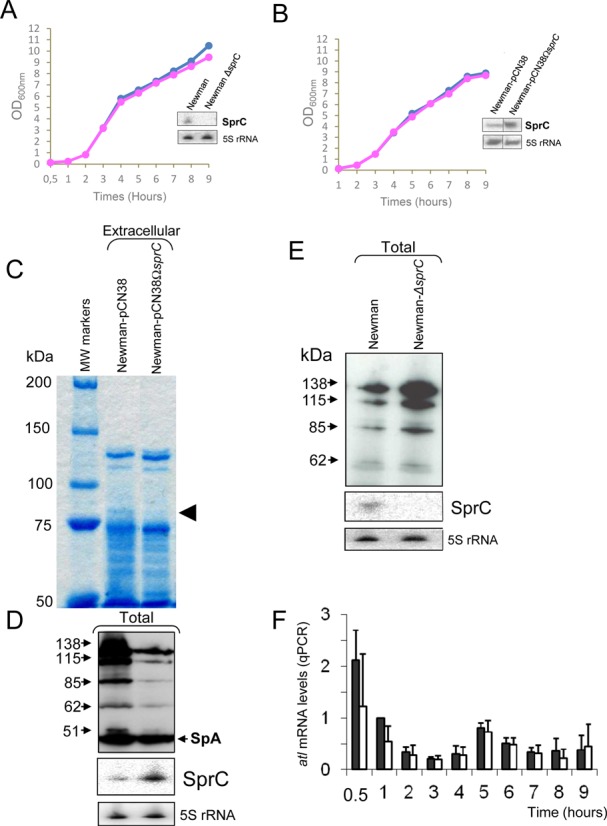
Figure 1.

S. aureus SprC sRNA (srn_3610) lowers the expression levels of the major autolysin ATL. (A) Monitoring the bacterial growth and SprC expression levels, by Northern blots (OD600nm: 2), in S. aureus strains Newman (blue diamonds), Newman-ΔsprC (pink rectangles). (B) Monitoring the bacterial growths and SprC expression levels, by Northern blots (OD600nm: 2) of Newman-pCN38 (blue diamonds) and Newman-pCN38ΩsprC (pink rectangles). The 5S rRNAs are the loading controls. (C) Coomassie staining of SDS-PAGE of the exoproteins in strain Newman overexpressing (WT-pCN38ΩsprC), or not (WT-pCN38), SprC (OD600 = 7). The arrows point to the reduced levels of a protein when SprC is overexpressed. (D) Immunoblot analysis with anti-autolysin (anti-ATL) antibodies to monitor the levels of the ATL protein produced as five distinct translational products (23) in strain Newman overexpressing (WT-pCN38ΩsprC), or not (WT-pCN38), SprC. Reduced levels are detected for all the ATL protein products when SprC is overexpressed. Northern blot analyses of SprC expression levels in strains ‘WT-pCN38’ and ‘WT-pCN38ΩsprC’ demonstrating SprC overexpression when collecting the exoproteins. 5S rRNAs are the loading controls, ‘Spa’ corresponds to ‘Surface protein A’. (E) Lacking sprC increases S. aureus ATL expression levels. Immunoblots with anti-ATL antibodies to monitor the expression levels of ATL in S. aureus wild type strain (WT) and its isogenic strain lacking sprC (ΔsprC). Northern blot analyses of SprC expression levels in strains ‘WT’ and ‘ΔsprC’ demonstrating the absence of SprC expression in the mutant strain. 5S rRNAs are the loading controls. (F) qPCR analysis of the atl mRNA expression levels during bacterial growth in strains Newman ‘WT-pCN38’ (black bars) and ‘WT-pCN38ΩsprC’ (white bars). Using the comparative Ct method, the amount of RNAs was normalized against the expression of the hu reference gene and referred to the Newman ‘WT-pCN38’ after 1 h of bacterial growth. The data shown are the mean and the error bars indicated representing Standard Deviation (SD) are derived from three independent experiments.
