Figure 2.

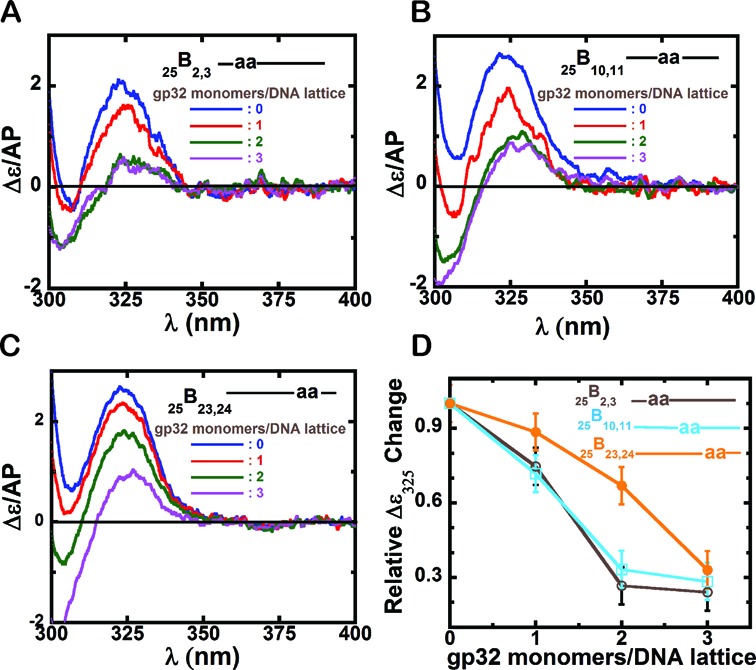
Circular Dichroism spectral changes for 25-mer ssDNA constructs with 2-AP dimer probes at various positions within the ssDNA lattice. Panels A–C show CD spectra of the various ssDNA constructs upon addition of increasing concentrations of gene 32 protein, expressed as gp32 monomers added per ssDNA lattice present. (A) 25B2,3 construct; (B) 25B10,11 construct; and (C) 25B23,24 construct. In each panel the color code for the CD spectra are as follows: blue: ssDNA construct only; red: 1 gp32 monomers per 25-mer ssDNA lattice; green: 2 gp32 monomers per lattice; and purple: 3 gp32 monomers per lattice. (D) Relative Δϵ/AP change at 325 nm for each construct with increasing concentrations of gp32. The x-axis is expressed in units of gp32 monomers added per ssDNA lattice. 25B2,3 construct (grey, open circles); 25B10,11 (cyan, open squares) and 25B23,24 (orange, closed circles).
