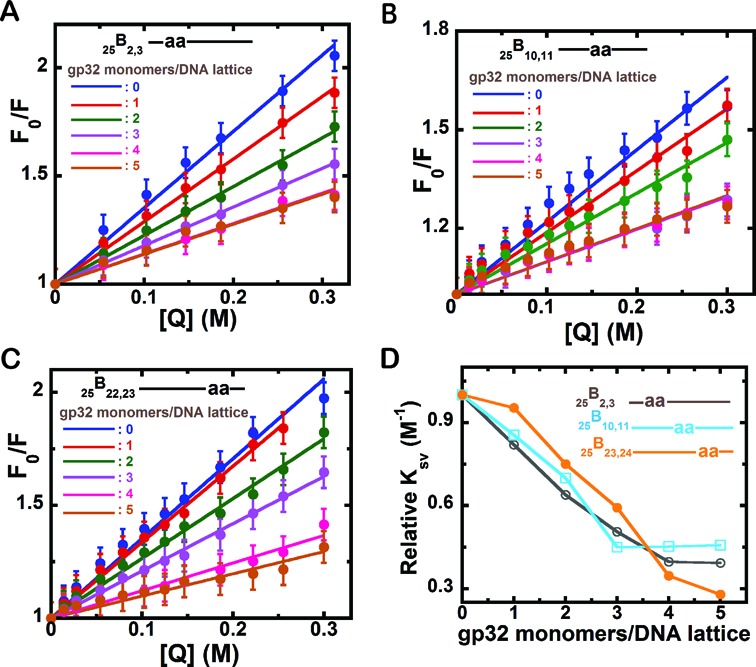
Figure 3.

Acrylamide quenching Stern–Volmer plots of 2-AP dimer-labeled 25-mer-ssDNA constructs with increasing concentrations of gp32 monomer added per 25-mer ssDNA lattice. (A) 25B2,3 construct; (B) 25B10,11; and (C) 25B23,24. The individual plots within each panel correspond to the various input concentrations of gp32 expressed as gp32 monomers added per ssDNA lattice, and are (for each spectrum): blue: 0; red: 1; green: 2; purple: 3; pink: 4; and brown: 5 gp32 monomers added per 25-mer lattice. Fo/F (y-axis) corresponds to the fluorescence intensity in the absence of quencher divided by the fluorescence at the given quencher concentration and [Q] (x-axis) is the molar concentration of acrylamide monomers. The initial concentrations of the ssDNA lattice constructs in each titration were 1 μM. (D) Relative changes in the slope of the Stern–Volmer plots for each construct with increasing concentrations of gp32. 25B2,3 construct (grey, open circles); 25B10,11 (cyan, open squares) and 25B23,24 (orange, closed circles). The x-axis is expressed in units of gp32 monomers added per ssDNA lattice present.
