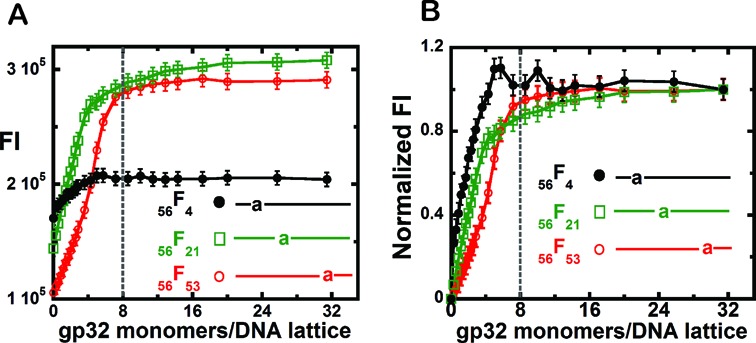
Figure 5.

Fluorescence intensity changes at 370 nm observed for the gp32 titration of 56-mer-ssDNA constructs with 2-AP monomer probes at various positions. (A) Fluorescence intensity changes of the DNA constructs (1 μM) upon the addition of various concentrations of gp32 per 56-mer ssDNA lattice. 56F4 construct (black curve, closed circles); 56F21 construct (green curve, open squares); and 56F53 construct (red curve, open circles). (B) Normalized fluorescence intensity changes of these DNA constructs (1 μM) upon addition of increasing concentrations of gp32 per ssDNA lattice. Same constructs and color-coding as in (A). The dashed vertical lines represent the expected saturation point at 8 gp32 monomers added per 56-mer ssDNA lattice.
