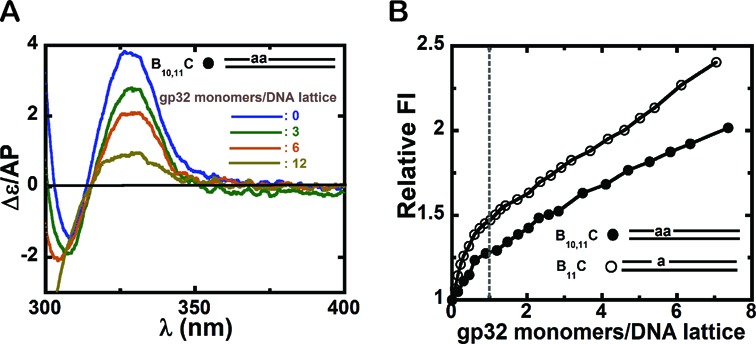
Figure 6.

Circular dichroism and fluorescence intensity changes observed for dsDNA constructs with 2-AP dimer or monomer probes site-specifically positioned within duplex DNA constructs. (A) CD spectra for a 25B10,11–25C dsDNA construct consisting of a 25B10,11 ssDNA lattice complexed to a fully complementary 25C ssDNA lattice in the presence of increasing concentrations of gp32 monomers. blue: free DNA construct; green: 3; brown: 6; and olive green: 12 gp32 monomers present per dsDNA lattice. (B) Normalized (to unity) fluorescence intensity changes at 370 nm for 1 μM 25B10,11–25C and 25B11–25C dsDNA constructs plotted as a function of gp32 monomers per dsDNA construct. Construct 25B11–25C (open circles) and 25B10,11–25C (closed circles). The dashed vertical line marks the point at which one gp32 monomer has been added per dsDNA construct.
