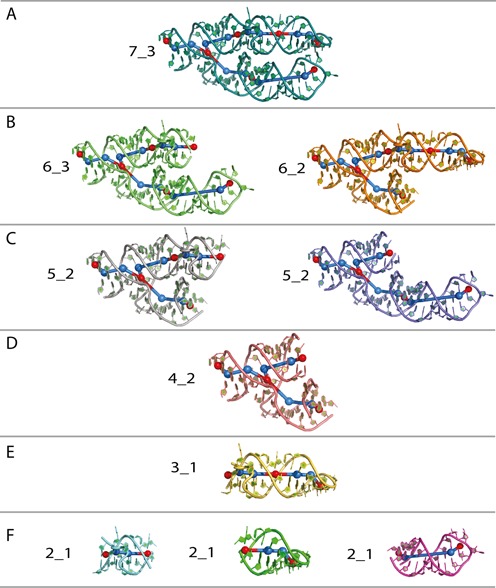
Figure 6.

Substructures extracted from a 7S.S SRP RNA (PDB ID: 1LNG) are shown in (A-F). All-atom structures shown in color, the 3D subgraphs are in blue and red. The vertices that are at the center of the loops or junctions or hairpins are indicated in red whereas the additional vertices are indicated in blue.
