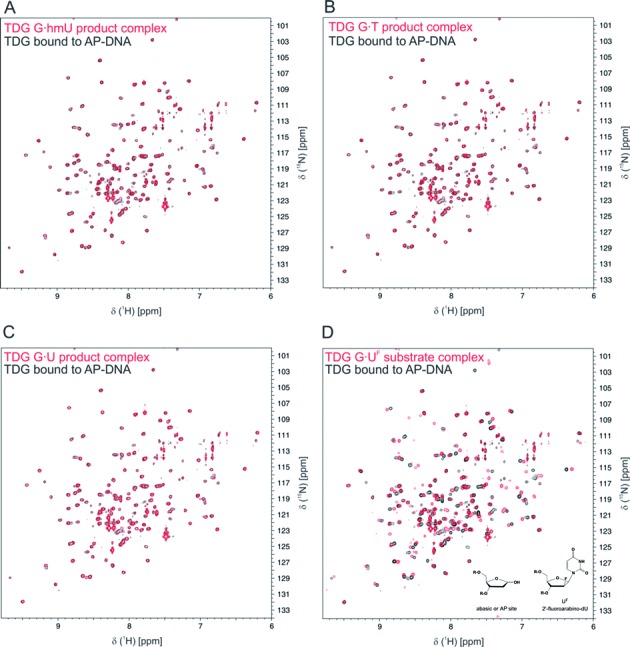
Figure 4.

NMR studies also indicate that the excised base is released from enzyme–product complexes. All four panels shown an identical 15N-TROSY spectrum for TDGcat bound to AP-DNA (black peaks); the sample was prepared by adding TDGcat to purified abasic DNA (AP-DNA). The red peaks in panels A–C are 15N-TROSY data for enzyme–product complexes resulting from TDGcat action on various substrates, including G·hmU (A), G·T (B) and G·U (C). The absence of substantial chemical shift changes indicates that the excised base is released from the enzyme–product complex. (D) The red peaks are 15N-TROSY data for TDGcat bound to DNA containing a G·UF base pair; UF is a dU analog that flips into the active site but cannot be cleaved by TDG. Substantial chemical shift changes are observed for most backbone 15N-1H resonances; the DNA differs at only one nucleotide (AP site versus UF, see inset). Samples contained 0.25 mM 15N-labeled TDGcat, 0.30 mM DNA, 5 mM Tris–HCl pH 7.5, 0.2 M NaCl, 0.2 mM DTT, 0.2 mM EDTA, 10% D2O.
