
Figure 2.
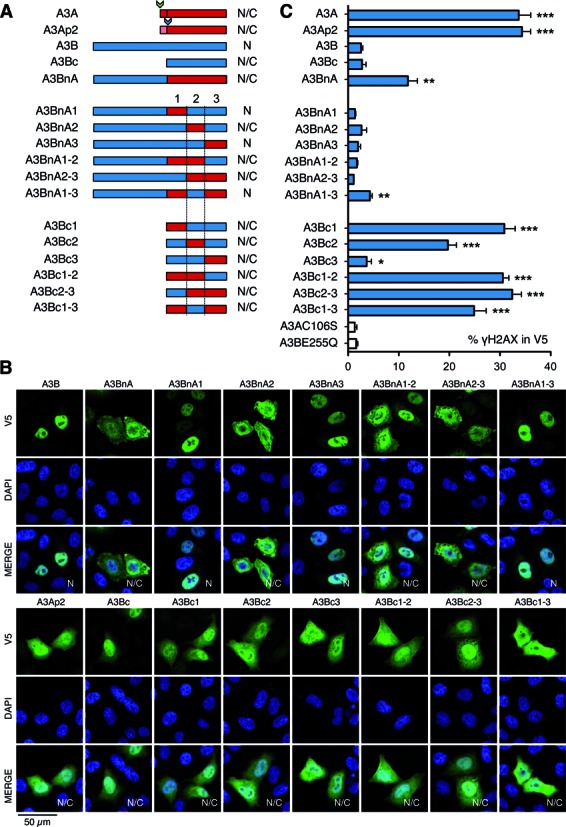
Schematic representation of A3BnA and A3Bc and cellular localization of A3 proteins. (A) Schematic representation of A3BnA and A3Bc derived chimeras. (B) Cellular localization of A3 proteins. Confocal microscopy of V5 tagged A3 proteins performed in HeLa cells 24 h post-transfection. Nuclei are stained using DAPI. N: nuclear localization, N/C: nucleo-cytoplasmic localization. (C) FACS analysis of γH2AX-positive HeLa cells gated on V5-positive cells after A3 48 h post-transfection. Error bars represent SD from six independent transfections. Differences compared with A3AC106S catalytic mutant were calculated using the Mann–Whitney test (*P < 0.1, **P < 0.01, ***P < 0.001).