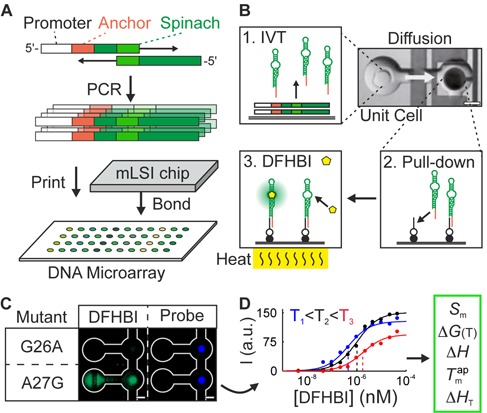
Figure 1.

The experimental workflow to determine binding and stability landscapes of fluorescent RNA aptamers. (A) A DNA mutant library was created by stitch PCR. DNA sequences encoding of the single- and double-point Spinach mutants were spotted on a glass microarray and bonded to a microfluidic polydimethylsiloxane (PDMS) chip. (B) On the chip, the DNA transcription (1), a miniaturized pull-down assay (2), and a perfusion system (3) for 640 RNA mutants were automated in separate microfluidic unit cells. The chip was mounted on a thin glass coated with indium tin oxide (ITO) for control of the temperature on the glass surface. (C) Fluorescent signals of two Spinach mutants in the pull-down area of a chip unit cell. The total amount of RNA in the pull-down area was quantified with a probe molecule. (D) The binding and melting curves were used to calculate the free energy (ΔG), and enthalpy (ΔH) of the binding, the apparent melting temperature of the RNA–DFHBI complex ( ), and the fluorescence intensity of the Spinach complexes (S) with 3,5-difluoro-4-hydroxybenzylidene imidazolinone (DFHBI).
