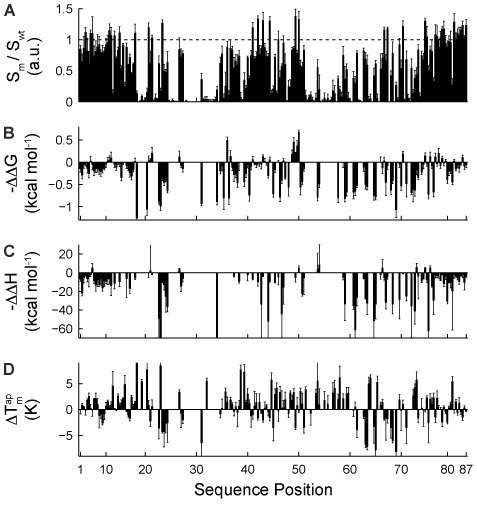
Figure 2.

Single-point mutation (SPM) landscapes. (A) The normalized fluorescent signal of the Spinach mutant (Sm) to the Spinach wt (Swt), (B) free energy (ΔΔG), (C) enthalpy (ΔΔH), and (D) Δ  . of SPMs, where all values are relative to the WT Spinach. For each sequence positions of Spinach the two transversion and one transition mutation were included.
