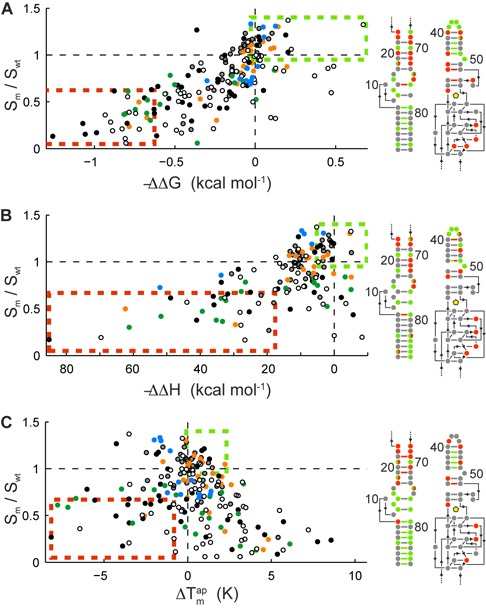
Figure 5.

Identification of beneficial traits for engineering of Spinach variants. Correlation of the Spinach fluorescent signals with the (A) free energy of binding (ΔΔG), (B) binding enthalpy (ΔΔH), and (C) apparent melting temperature of the Spinach mutants in complex with DFHBI. All values are relative to WT Spinach. The color-coding in all panels corresponds to the structural elements of Spinach shown in Figure 3A. Mutations within the upper and lower 10% quantile are highlighted within a green and orange box, respectively. These beneficial and disadvantageous mutations are mapped on the 2D structure plot on the right with the same color code.
