Figure 2.

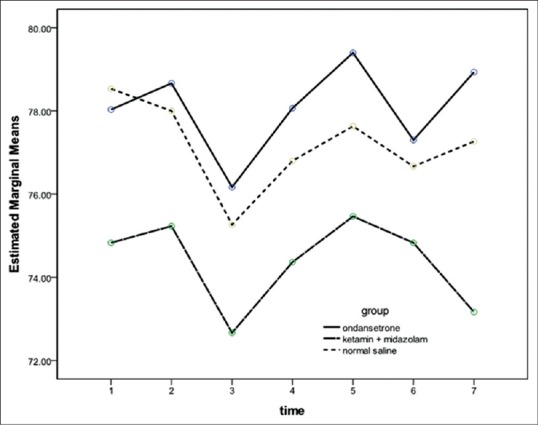
Mean arterial pressure changes in three groups. There was no significant difference between the groups. Data are presented as mean ± standard deviation Group O = Ondansetron group; Group KM = Ketamine + midazolam group; C = Control group

Mean arterial pressure changes in three groups. There was no significant difference between the groups. Data are presented as mean ± standard deviation Group O = Ondansetron group; Group KM = Ketamine + midazolam group; C = Control group