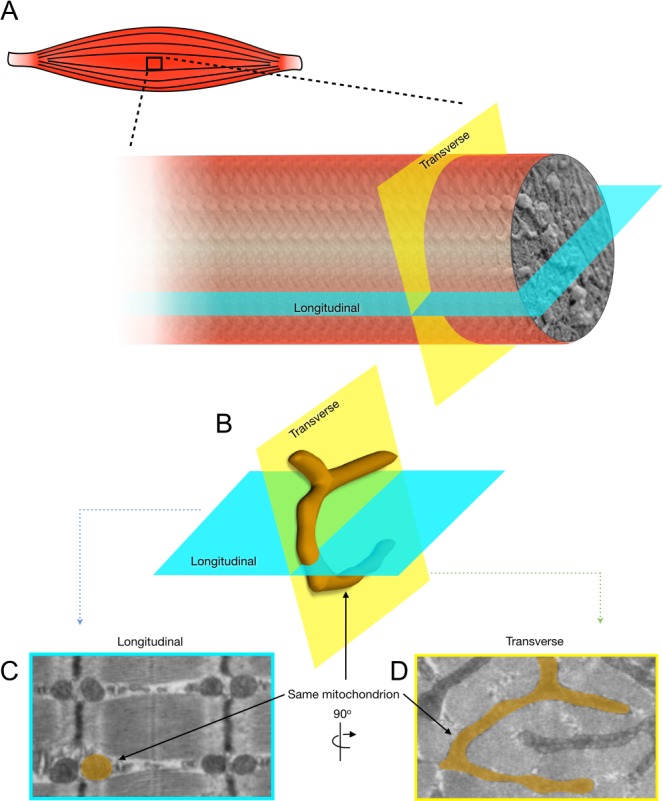
Figure 3. 2-Dimensional analysis of mitochondrial morphology in skeletal muscle.

The present figure illustrates the approach used in the present manuscript to accurately assess the impact of skeletal muscle aging on mitochondrial morphology. A. Representation of the longitudinal and transverse orientation of a skeletal muscle fiber. B. 3-D representation of a skeletal muscle mitochondrion (highlighted in orange) and its corresponding shapes in longitudinal C. and transverse D. planes when imaged using transmission electron microscopy.
