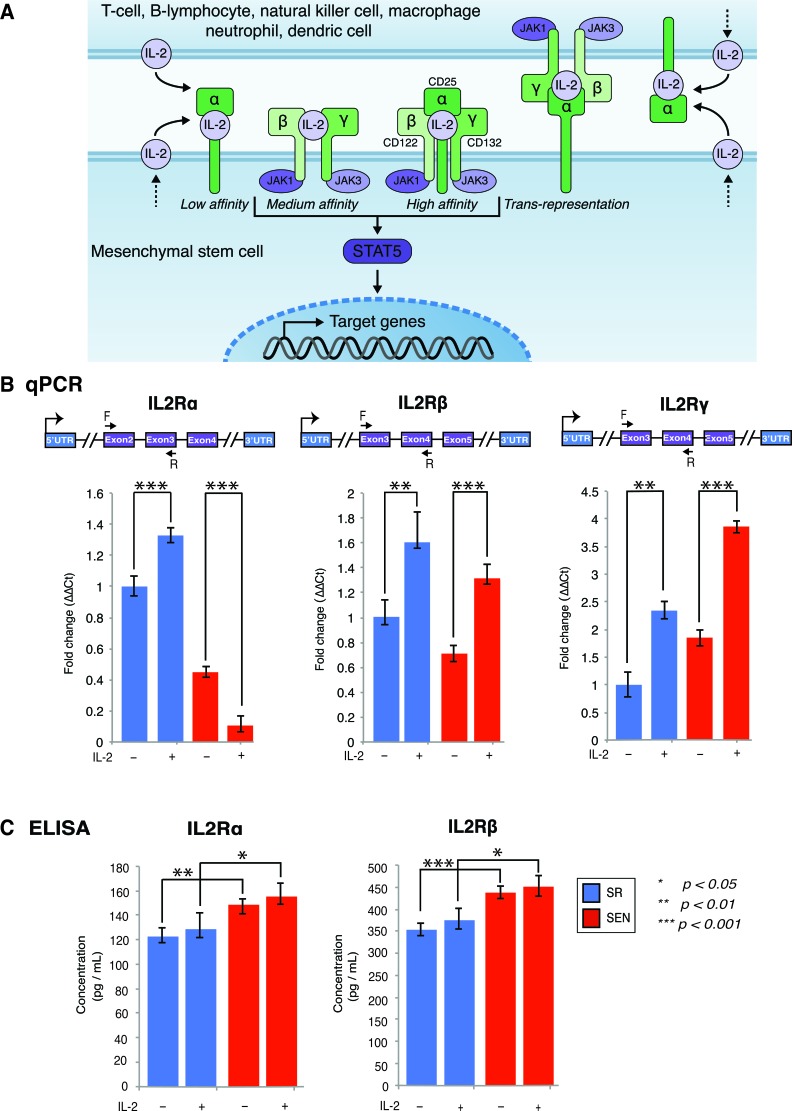
Figure 2. Gene expression of IL-2 receptor isoforms and their association with membrane in self-renewing (SR) and senescent (SEN) hADSCs primed with IL-2.
A. Three classes of IL-2 receptors (high-affinity, intermediate affinity, and low affinity), with receptor composition and associated JAK kinases are shown as cartoon. Trans-presentation of IL-2Rα expressed by MSCs to immune cells that expresses IL-2Rβ and IL-2Rγ has been depicted separately. The soluble IL-2 receptor (soluble sIL-2Rα) with bound IL-2 is not shown in the figure. B. IL-2 receptors α, β, γ assessed by quantitative PCR in un-stimulated (IL-2-) senescent (red) and self-renewing (blue) hADSCs and upon stimulation with 20ug/ml of recombinant IL-2 (IL-2+). Data shown as fold change ΔΔCT Mean +SD from three independent experiments is show. Position of the q-PCR primers off line are depicted graphically C. Cellular membrane associated levels of IL-2Rα and IL-2Rβ were quantified by ELISA in un-stimulated (IL-2-) senescent (SEN-red) and self-renewing (SR-blue) hADSCs and upon stimulation with 20ug/ml of recombinant IL-2(IL-2+). Data are expressed as picogram per milliliter. Results are the mean of three independent experiments (mean ± SD). Statistical significance was estimated by t - test, where ***p < 0.001, **p < 0.01, *p < 0.05.

