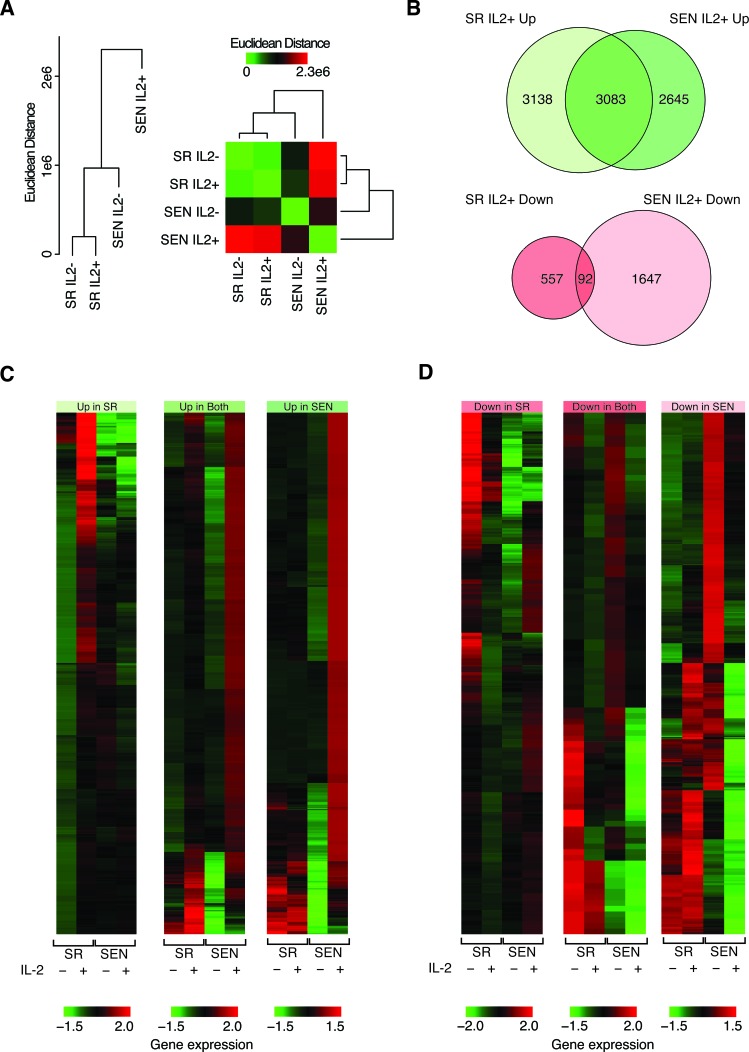
Figure 4. Comparison of gene expression levels between self-renewing and senescence hADSCs upon IL-2 treatment.
A. Hierarchical clustering showing the pairwise distance between conditions based on comparison of condition-specific gene expression profiles. B. Venn diagram showing the numbers of genes, which are up-regulated and down-regulated upon IL-2 treatment. C. & D. Heatmap showing the expression levels of genes that are up-regulated C. and down-regulated D. upon IL-2 treatment. Normalized gene expression levels are color coded as shown in the legend (red = high & green = low). Groups correspond to genes that are up- or down-regulated in SR-only, SEN-only or both conditions.

