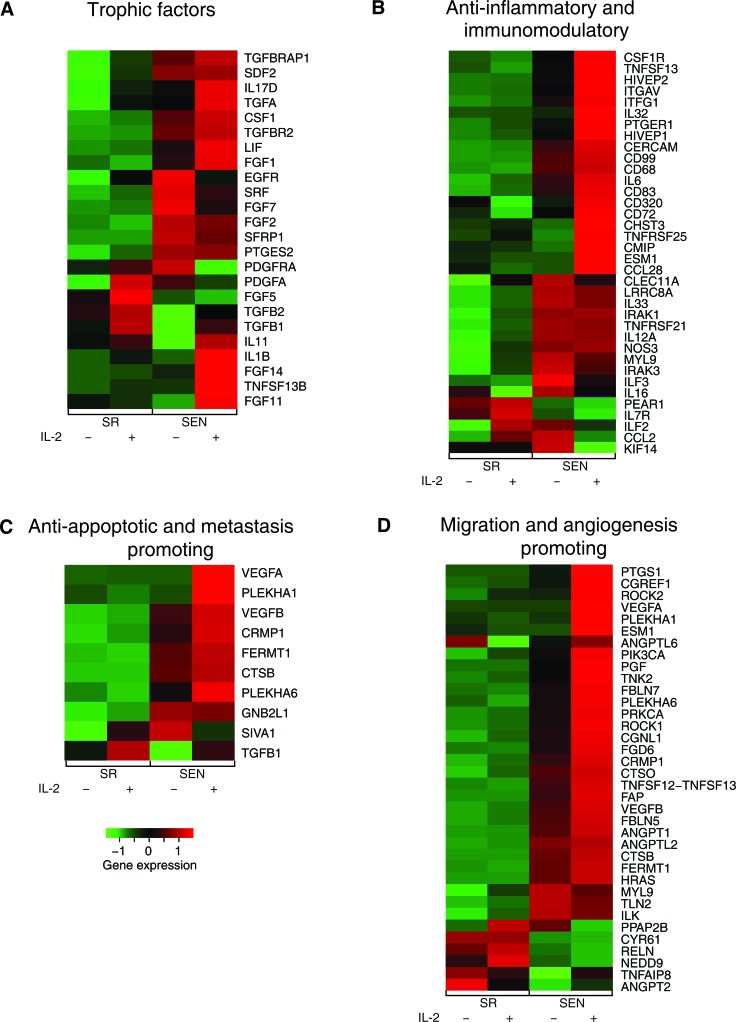
Figure 5. Gene expression levels for self-renewing and senescence hADSCs upon IL-2 treatment among functionally coherent sets of genes.
Expression levels are shown for sets of genes characterized as A- trophic factors, B- anti-inflammatory and immunomodulatory, C- anti-apoptotic and metastasis promoting, and D. migration and angiogenesis promoting. Normalized gene expression levels are color coded as shown in the legend (red = high & green = low).

