
Figure 1. Levels of miR-23b are down-regulated in stomach adenocarcinoma samples, whereas transcripts of Notch2 receptor, Ets1, and E2F1 are up-regulated.
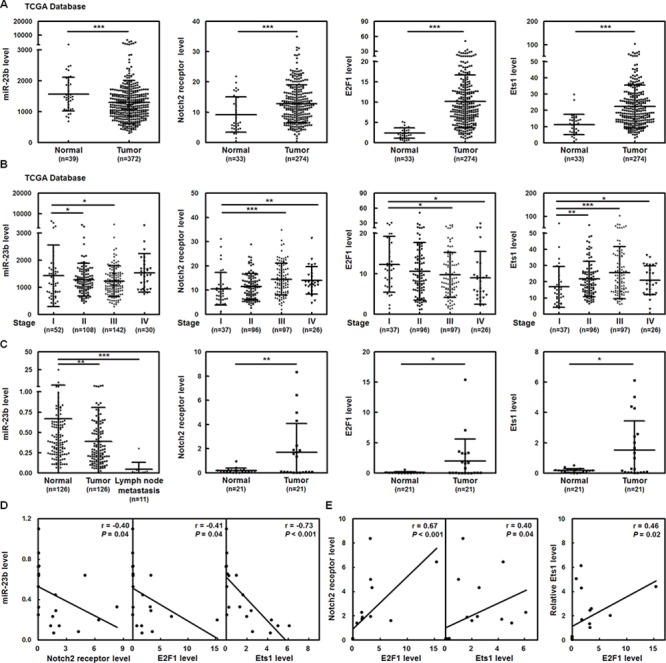
A. Level 3 data of mRNA and miRNA expressions from stomach adenocarcinoma samples and normal tissue samples were downloaded from the TCGA and Broad GDAC Firehose data portal. The mRNA RPKM (Reads per Kilobase of exon model per Million) and microRNA reads per million mappable reads of all samples were selected and analyzed for comparing abundances by GraphPad Prism 5 software. The transcript levels of miR-23b, Notch2 receptor, E2F1, and Ets1 in stomach adenocarcinoma samples (miR-23b, n = 372; Notch2, E2F1, and Ets1, n = 274) and normal tissue samples (miR-23b, n = 39; Notch2, E2F1, and Ets1, n = 33) were measured by RNA sequencing in TCGA data. ***P < 0.001. B. The transcript levels of miR-23b, Notch2 receptor, E2F1, and Ets1 in stomach adenocarcinoma samples were downloaded and then divided according to the stage classification. Transcript levels of miR-23b, Notch2, E2F1, and Ets1 in the gastric cancer tissues of stages II to IV were compared with those of early stage I. *P < 0.05; **P < 0.01; ***P < 0.001. C. Tumor, the adjacent non-tumor tissue, and lymph-node tumor sample pairs from gastric cancer patients (miR-23b in tumor and the adjacent non-tumor tissue, n = 126; miR-23b in lymph-node tumor samples, n = 11; Notch2, Ets1, and E2F1, n = 21) were examined using quantitative real-time PCR analysis. Levels of miR-23b and Notch2, E2F1, and Ets1 mRNAs in the gastric cancer tissues or lymph-node tumor samples were compared with those of the corresponding adjacent normal tissues. *P < 0.05; **P < 0.01; ***P < 0.001. Data are shown as mean ± standard deviation. D-E. The correlation between miR-23b and Notch2 receptor, E2F1, or Ets1 mRNA expressions D and among Notch2 receptor, E2F1, and Ets1 mRNA expressions E in the tumors from 21 gastric cancer patients was analyzed by Pearson correlation analysis.