
Figure 4. Effect of Torin2 on mTOR and mTOR-related protein expression and phosphorylation.
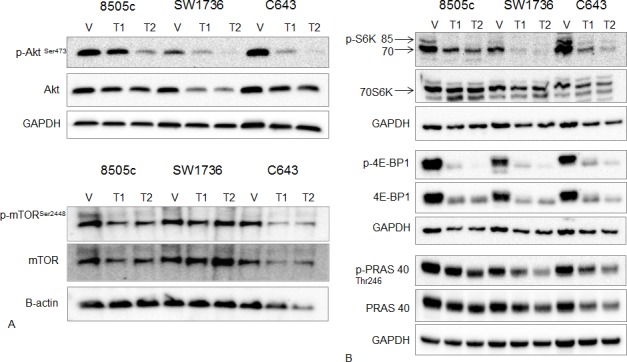
A. Western blot analysis of AKT, phospho-AKTSer473, mTORSer2448 (mTORC1 site) and total mTOR. ATC cells were treated with Torin2 for 48 hours at T1 = 0.05 μM and T2 = 0.14 μM. Beta-actin was used as a loading control for the mTOR blot because of the higher molecular weight. B. Western blot analysis of downstream targets of mTOR: phospho-S6K (p-S6K), total 70S6K, phospho-4E-BP1 (p-4E-BP1), total 4E-BP1, phospho PRAS40 (p-PRAS40) and total PRAS40 with Torin2 treatment for 48 hours in ATC cells at T1 = 0.05 μM and T2 = 0.14 μM.